Oh boy, this is a big one. A realllllly big one. So big, in fact, it may be the coolest blog post I’ve ever written. Ever.
TL;DR at the bottom
Note: This website looks nice on laptops. The images zoom in when you hover over them. That don’t happen on da phone, yo 🤘. Also this title is slightly click-baity. I did set up the website that touched a million views in 2 weeks, but there was a team of like 7-8 people.
This past one-ish month or so, I’ve been up to a lot. Let’s get two major things I’m happy about out of the way before I proceed to the title of this post itself.
- I got selected to be a Summer Research Intern at Rochester Institute of Technology, Rochester (New York) for this summer for 10 weeks under Professor Matthew Wright, The Director of The Center for Cybersecurity Research. I also got a $2,000 scholarship (OMG!). This is happening online this Summer!!!
- 5 students and I got selected for the final round of The Smart India Hackathon. We were one of six teams to get selected for the problem statement posed by a state government from all around the country.
SteaksStakes were high and we started working towards The SIH; the final round was to be held on the 4th & 5th of April. However, this got postponed to somewhere in July due to the COVID-19 Pandemic.
These were two huge accomplishments for me in the past month. But they were nothing compared to what was in store. 🥁🥁🥁 Begin drum roll 🥁🥁🥁
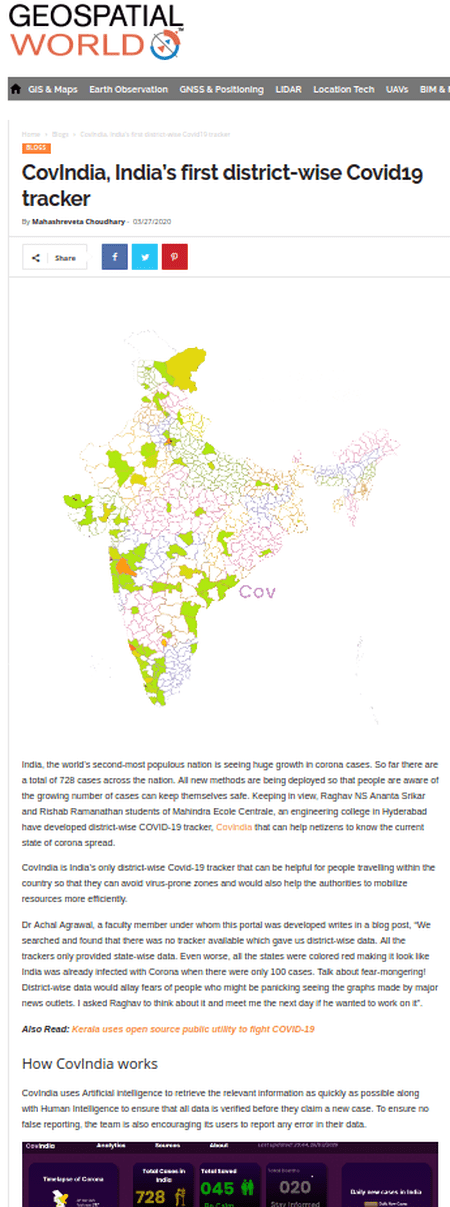
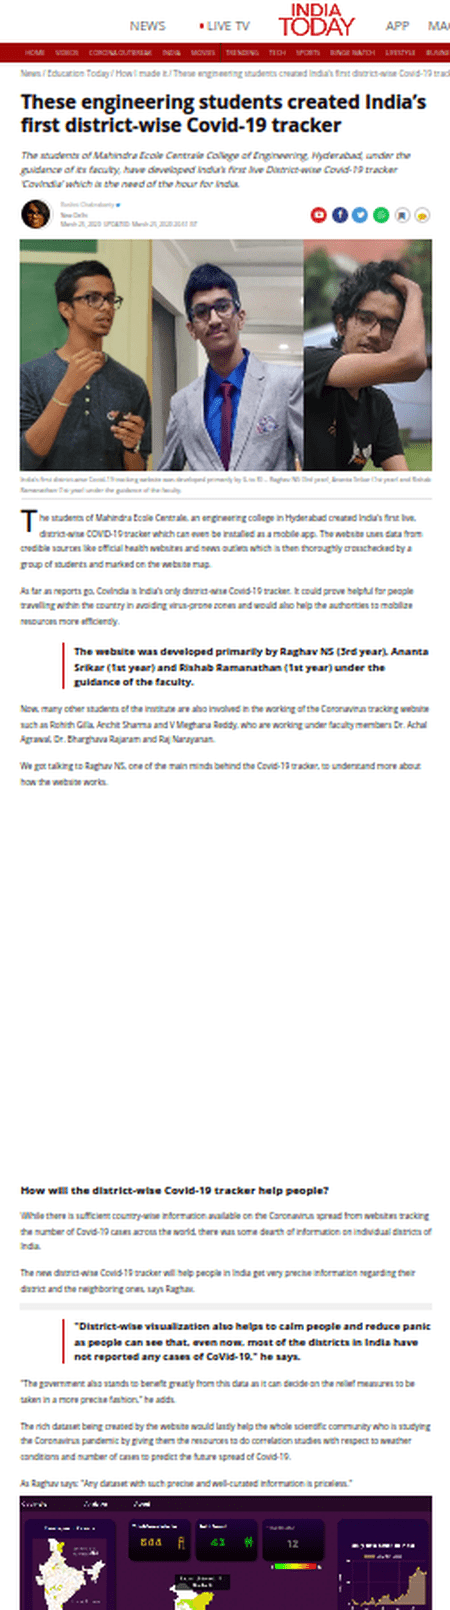
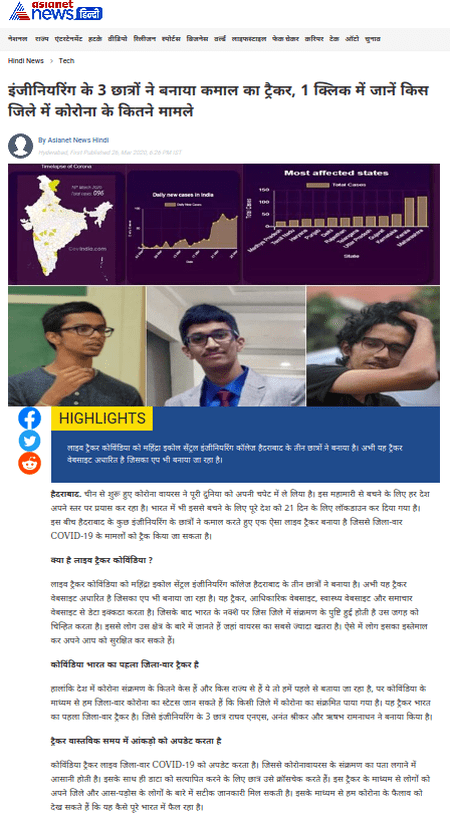
I, along with a few others, set up a website called CovIndia.com that hit 150,000 views in one week and 1,000,000 views in two weeks. I’ve had numerous people asking me how I set it up and how it all works and this blog post is going to be a long one going in depth on how CovIndia started, how it worked initially, how it works now, the reception, the failures faced, the mistakes made, news and media coverage and a hackathon. Let’s get started.
How it started
It all started with point number two of my two major things I’m happy about, The SIH. Our team’s SIH project was to be my Software Engineering final project and my Enterprising Software Architecture project. Naturally when The SIH got postponed to a date after the semester ended, I was a bit worried whether I’d have to start two new projects mid way through the semester. I went to consult the mentor and professor in-charge of the SIH, Dr. Achal Agrawal. We started talking about a few things and eventually the topic went to COVID-19 when Professor Achal mentioned that there were no district-wise visualizations of COVID-19 for India. We realized that the architecture / overall pipeline of a district-wise visualization would be quite similar to the architecture / pipeline of our SIH project.
He gave approximately a week to decide; I got bored and didn’t want to study for my exams and implemented a pre-alpha in around 3 hours. I sent Prof Achal an email at 1:21 AM with the code of the website I’d made and he replied back at 1:25 AM saying let’s put it up tomorrow. Little did we know how big this was going to become. The next day, we met on Skype in the afternoon and we briefly discussed the plan to go about. We initially thought that we could use NLP to understand news articles and insert data into a database, but then we realized that it was going to be quite hard for that to happen. Sentences like “Employee shows symptoms of Coronavirus” are enough to throw a quickly trained program off. Hence Prof Achal decided that we may need a few people who can help us get data manually for a week (this did not happen, they worked for far more time).
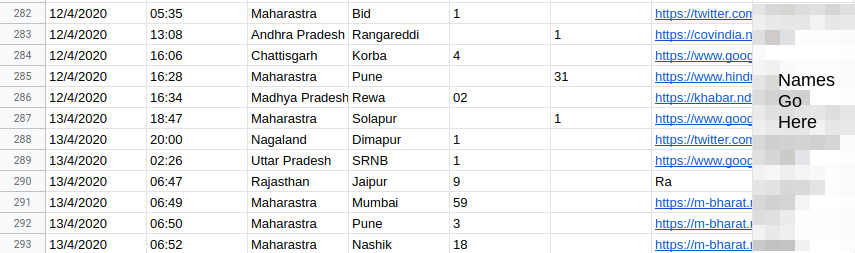
Enter Rishab and Srikar, two really smart freshmen who were willing to manually get data from news sources and insert them into the database for a week or two. They were stoked to be helping out on the project and wanted to use this as a chance to learn a bit more about CompSci and how stuff works. Once this was decided, we started working on the website to make it look a bit prettier. In the mean time, Prof Achal set up a small piece of code that let’s you download data from a Google Sheet using their API and I integrated that with a program that gets these values at a regular interval to pass it to another program that calculated the summation of the values of the districts. This program also inserted it into the raw html file and pushed it to Github.
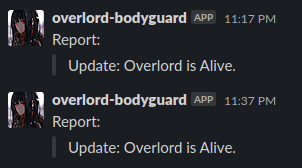
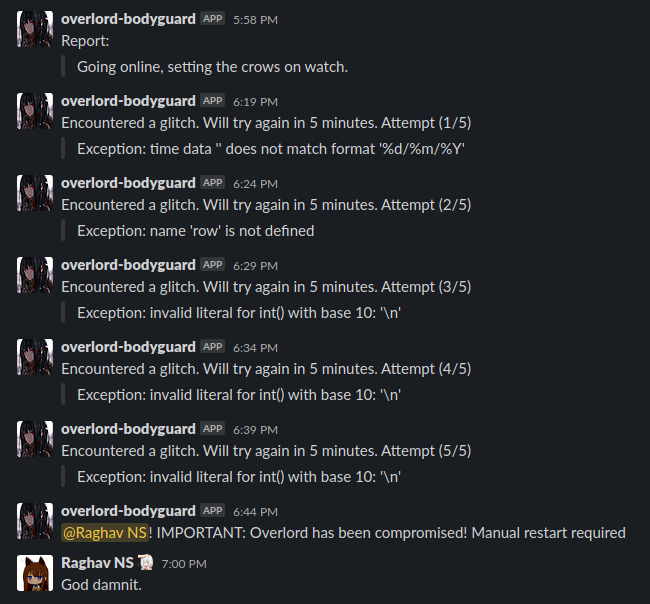
That night (the next morning actually 2020-Mar-14 01:00), I deployed the pages onto netlify and sent a message to everyone saying that our site was live. Srikar and Rishab, now called the ScrapBois, had set up a method that improved with time to gather data. This was it, our work was being shown live! I decided to let the program, now christened as overlord, shutdown for the night as they weren’t going to update values in the night. The next morning, I deployed it on a personal computer that runs in my college to keep updating the website and push it to Github so that netlify could build the pages (Continuous (and atomic) Deployment).
How it worked (version pre-alpha)
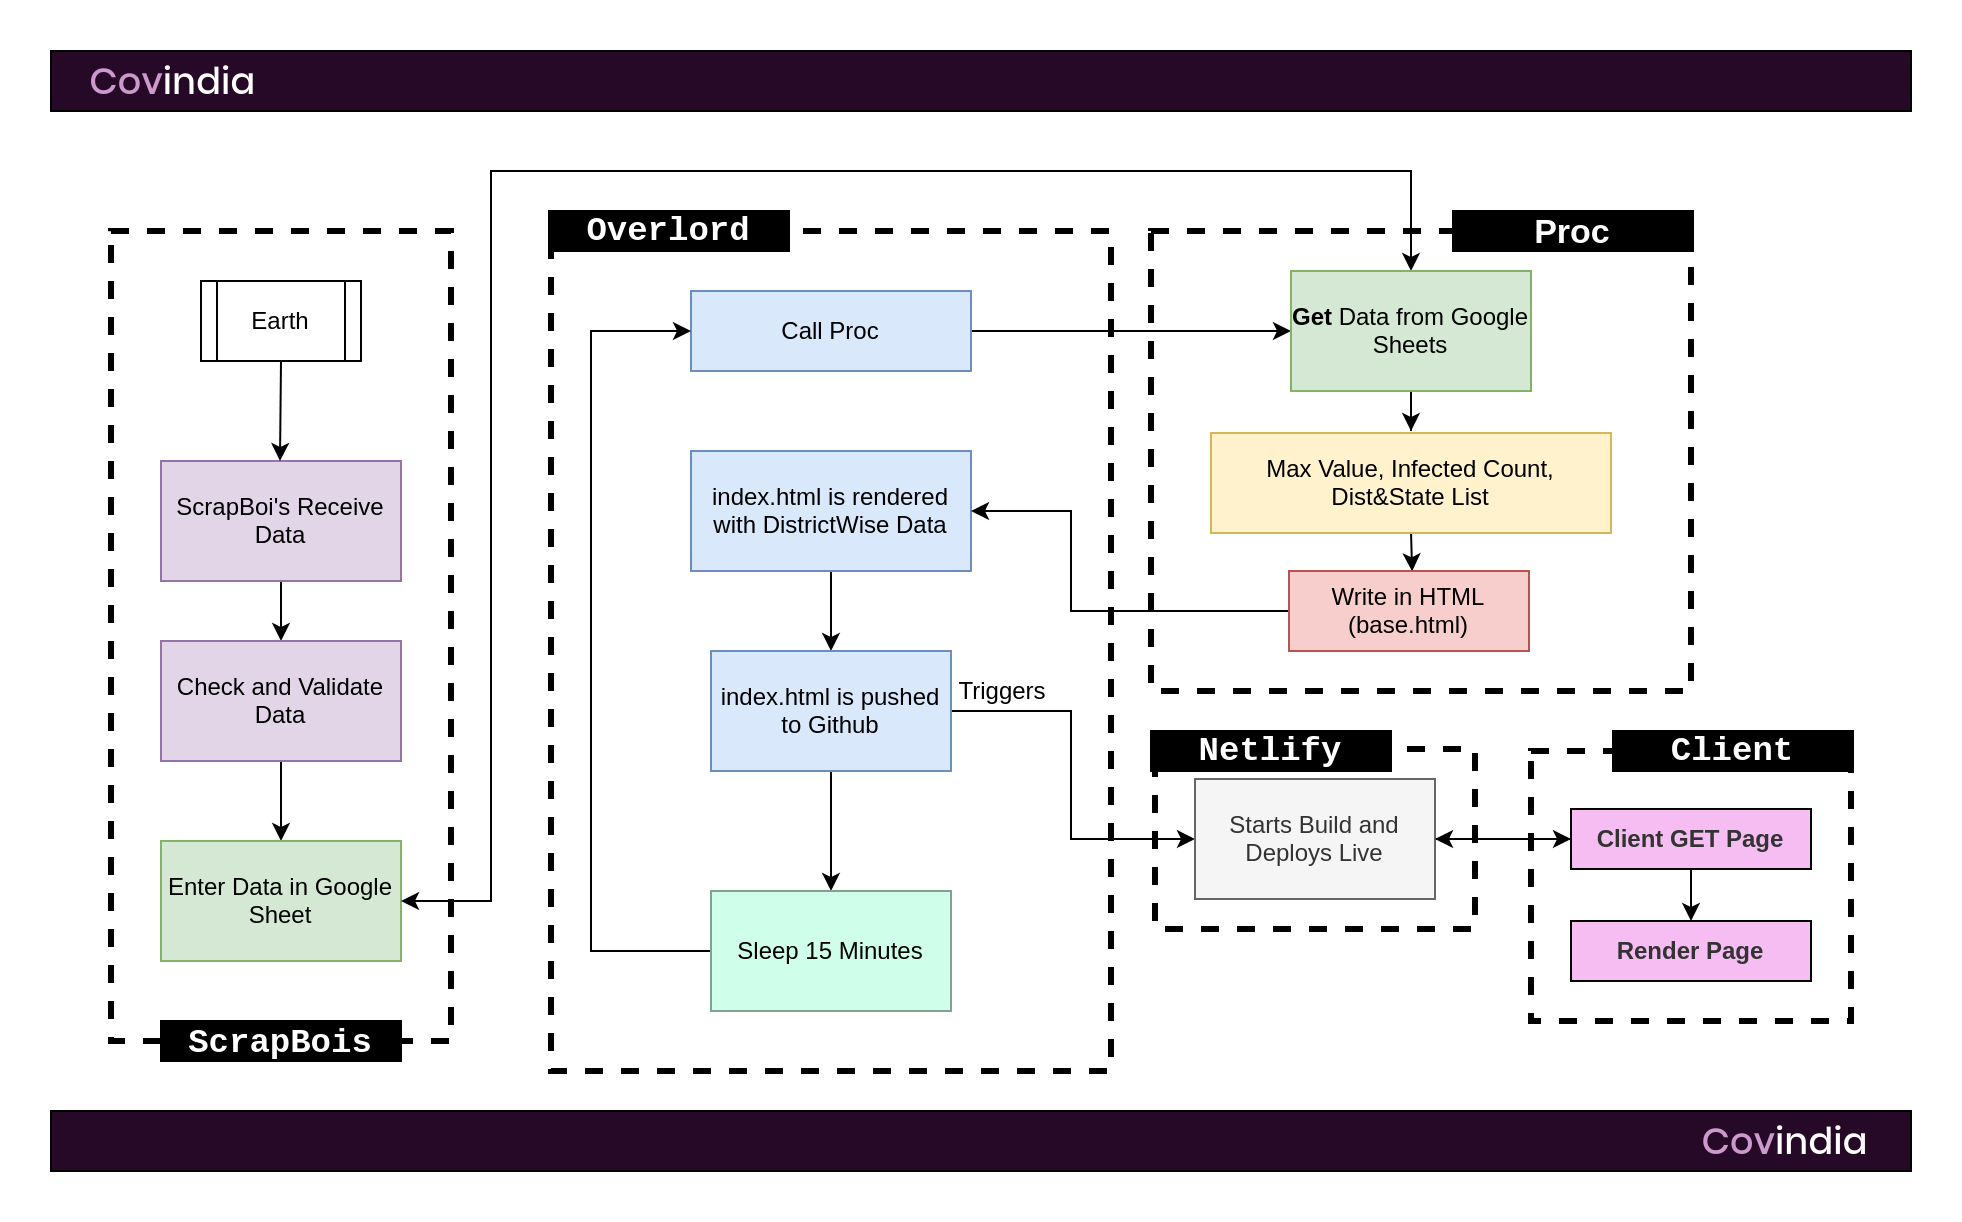
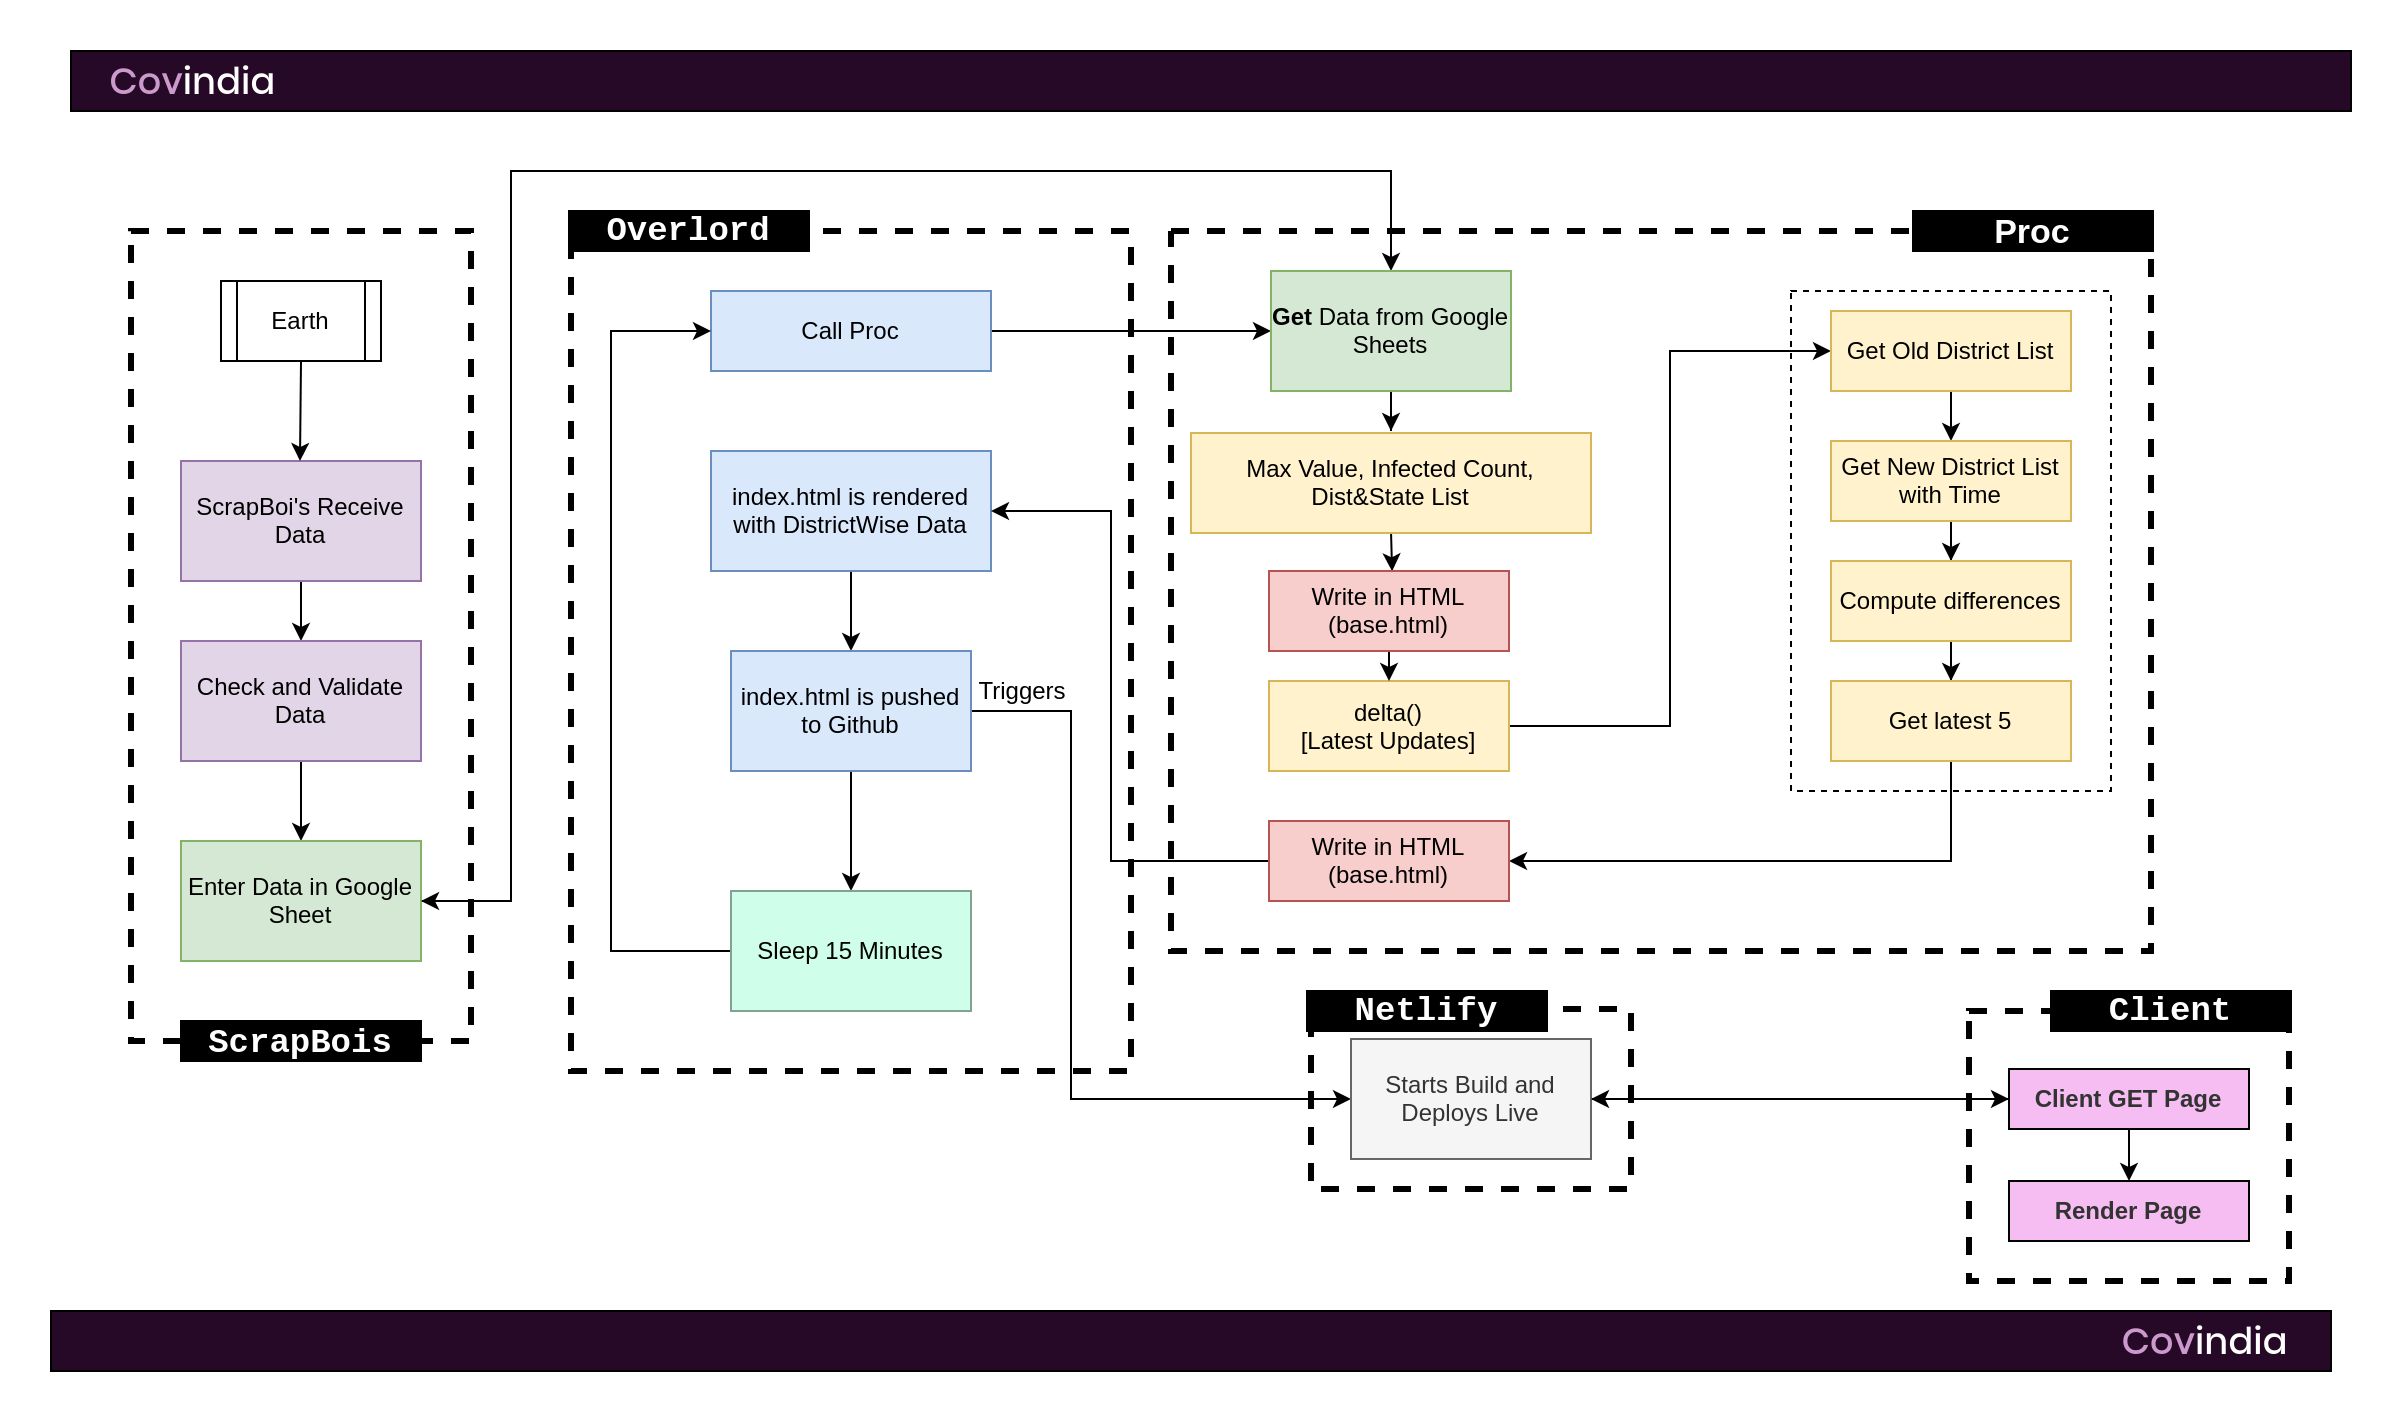
Software Architecture of Covindia Version Pre α (PreAlpha). Boy, was this so simple back then. Hover on the image for zooming in.
This version of Covindia was alive for only a few days and was primarily a bodge of a lot of code. I got the India district-wise map from gramener from which I wget-ed their page and sort of reverse engineered the javascript that triggered the colors of the map. In the mean time, Dr. Achal got a program that got data from a Google Sheet. All I had to do was integrate that program with proc. proc computed MaxValue, InfectedCount, District & State List and the individual district counts + values. After computing these numbers, proc read a template html file called base.html and wrote it to index.html with the values. Overlord had the credentials to CBot-Updater’s account on Github and pushed all changes to this Github Repo via this account. We had initial hiccups with a bit of the districts’ spellings as the map we got was slightly outdated and it was difficult for the ScrapBois to know which were which. Hence, I made a quick list of districts according to the map and they used that for reference.
Whenever CBot-Updater pushed index.html to Github, netlify was automatically triggered to build and deploy the build (Continuous Deployment) and updating the website for everyone. It was insanely simple the way Netlify set this up. The power of webhooks and web triggers is really mind-blowing.
Pre-Alpha was launched on Saturday, March 14th at around 1:30 in the morning and lasted for 4-ish days until Wednesday, March 18th. A major issue that we had to get over was that our college closed down on Sunday due to the Government’s order. We no longer could work in front of each other and had to rely on Slack to communicate.
When we got ~2,000 views on Monday, Prof. Achal decided to call in two professors who teach at our college: Dr. Bhargava Rajaram and Mr. Raj Narayanan. They were to help us in Marketing, Analytics and Design. As soon as Mr. Raj came in, we had a few major facelifts. Initially we had a black background which got changed to the purple you see on the website. We changed the logo, font’s and the placing and the website looked much more pleasing than before.
On Tuesday, we got two more people: Anchit and Meghana. Anchit was going to help us set up a twitter integration that would help us note errors and latest updates while Meghana would help us out by handling the Twitter account for an initial period.
On Wednesday, we started to realize that our website started picking up traffic when we saw that we had 30,000 views that day. Time to shift to an Alpha.
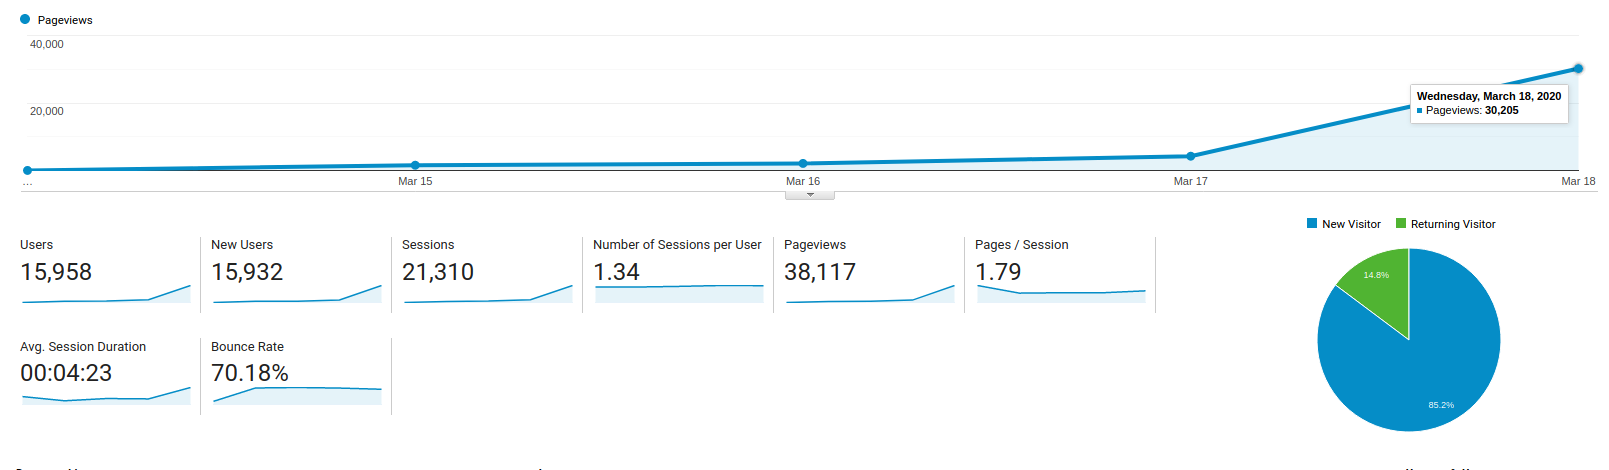
Analytics of Covindia Pre-Alpha. Wednesday was when we knew that we were becoming big. Hover on the image for zooming in.
How it worked (version alpha)
Software Architecture of Covindia Version α (Alpha). Things started getting messy around here. Hover on the image for zooming in.
Sigh, this is getting hard to type out. I have a lot left to say and I want to sleep. Anyywayyy, the pre-alpha phase was short and definitely not sweet. It was filled with a lot of bugs, was super inefficient and glitchy. Yet it ran and gave us the initial traffic we needed. The alpha phase didn’t have much of a difference other than a simple delta() in Proc which calculated the Latest Updates, i.e. the latest five new cases from our database. Not going to lie, it’s probably the worst code I’ve written in sometime. I definitely “over-coded” it to a point where it was no longer maintainable. You can find it: here. Good luck trying to understand it. It took me a approximately day to get this running and integrated with the website. The Alpha phase consisted more of marketing and minor technical updates that lasted for a few days before we shifted to the beta.
Towards the beginning of the Alpha phase, we got in three more people: Aman, Rohith and Qurram. Aman, Prof. Achal’s cousin, was to be our PandaScrapBoi (Panda because of Python3’s Pandas - A Data Analysis Library) who’d help out the ScrapBois with getting data, cleaning it up and consolidating them. Rohith was to help out with the front-end of the website. We had a lot of design overhauls that needed to be done along with a lot of minor bugs that had to rectified. I could no longer do all of these by myself and Rohith decided to help us out. After a few days, Qurram joined the team to help us even more with the front-end as the load was just super high. Rohith started working on graphs and analytics and I was working on restructuring a lot of the overall process (which was about to be the beta).
We also got a Marketing Team who would help us out in spreading the word. They did Instagram advertisements, Facebook advertisements and the handling of social media accounts. The team consisted of Kritvi, Sujay, Srivatsa, Soma Sai, Dhruv and Hari Kiran who really got us a lot of traffic.
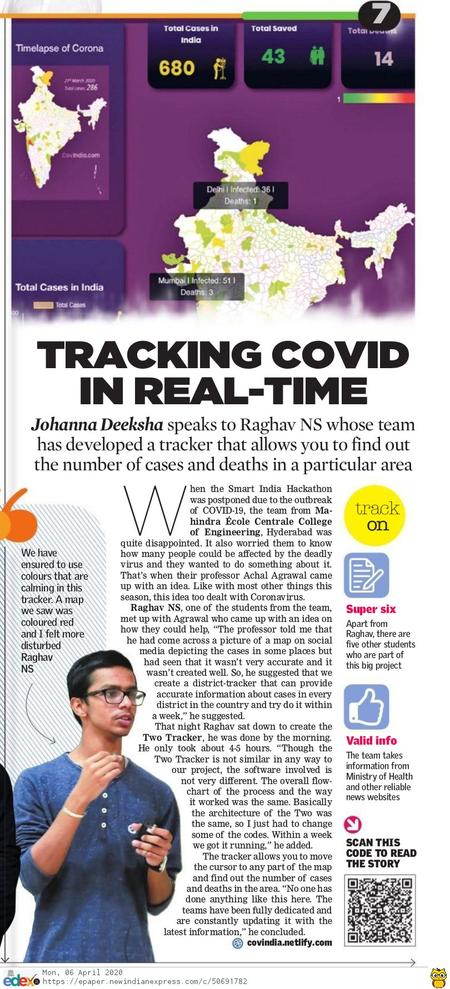
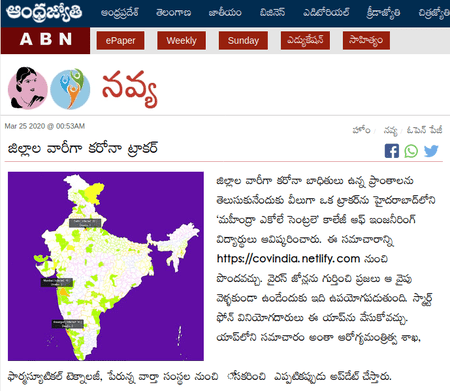
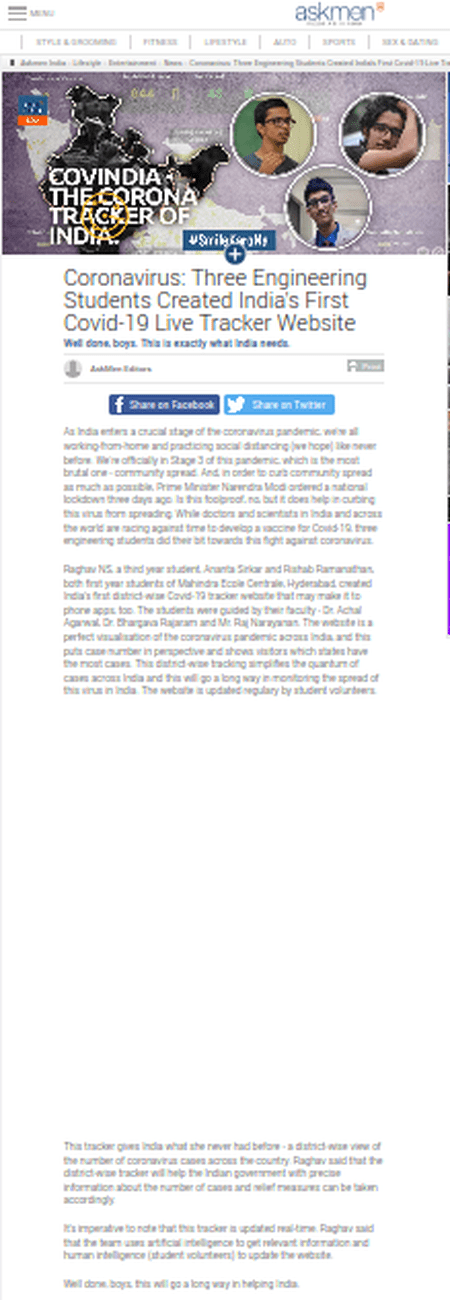
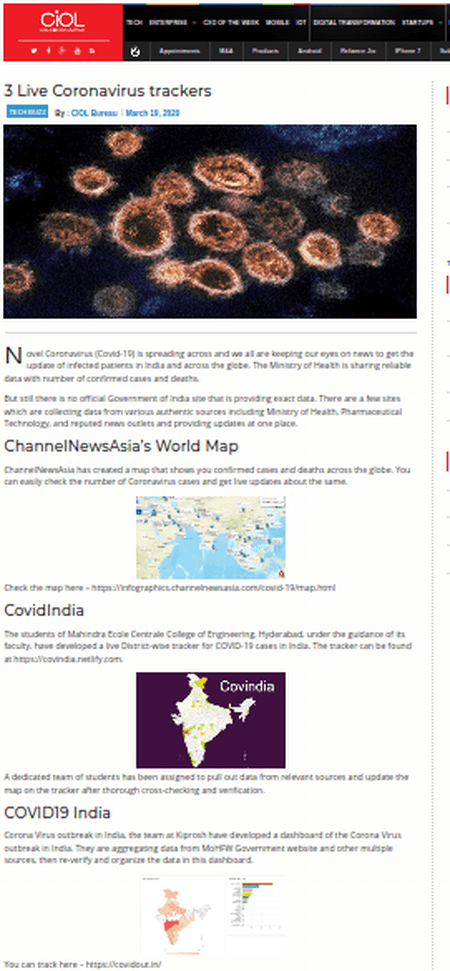
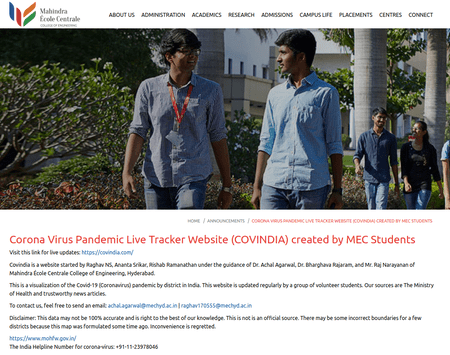
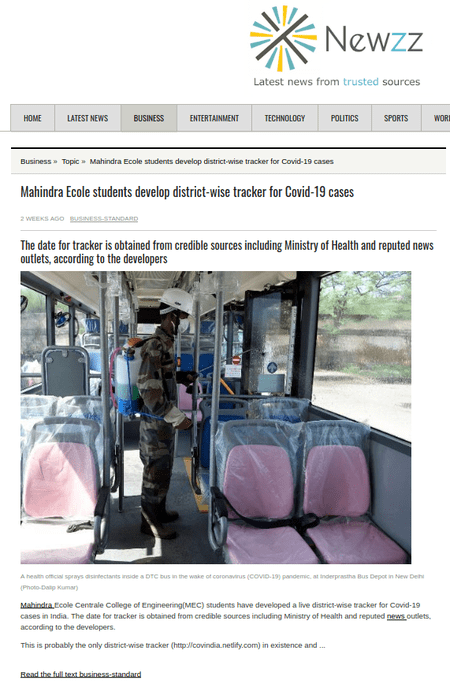
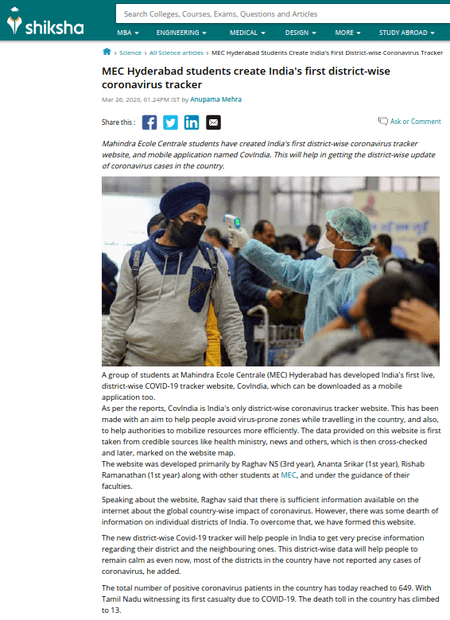
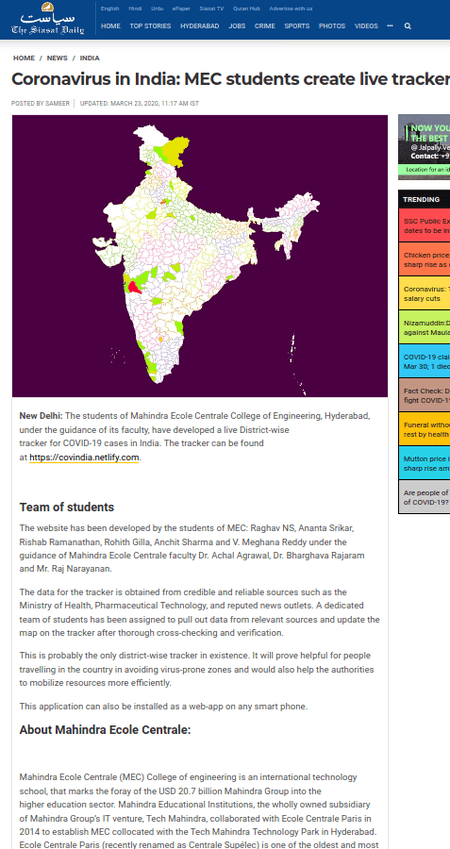
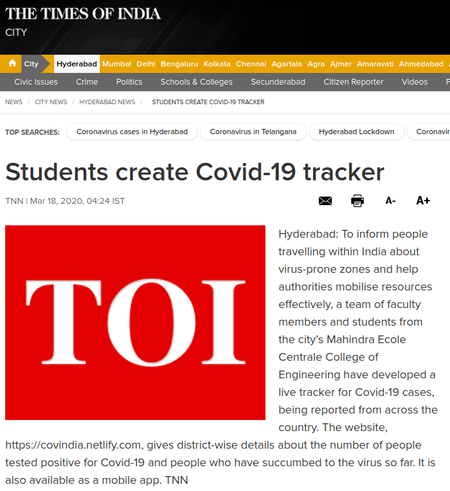
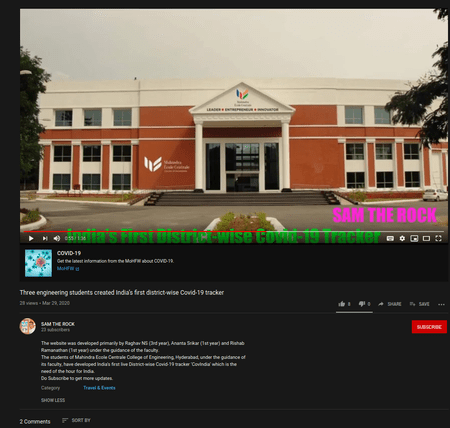
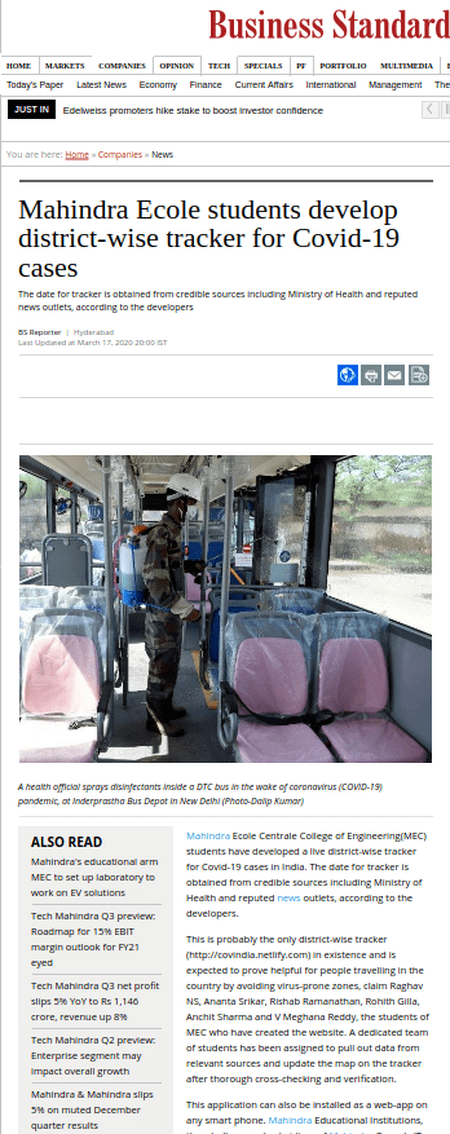
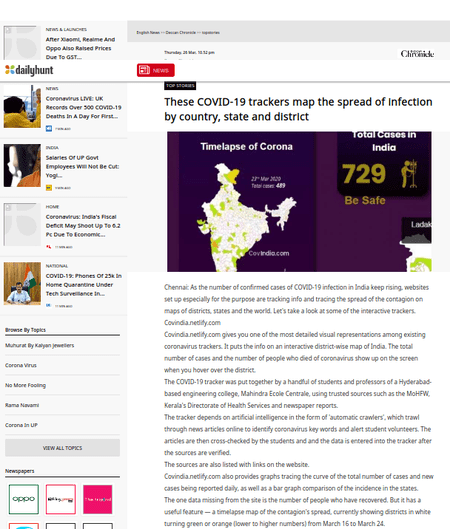
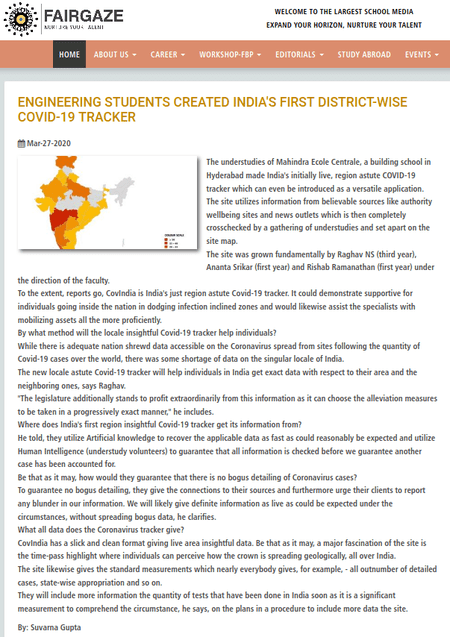
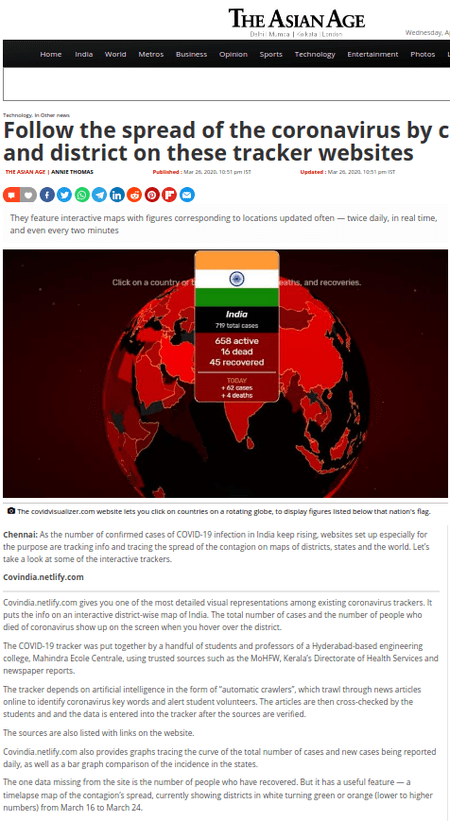
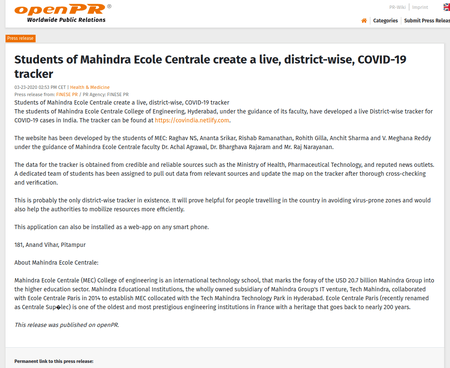
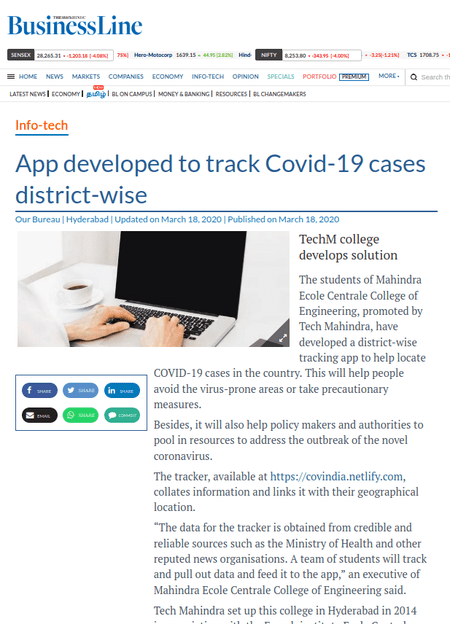
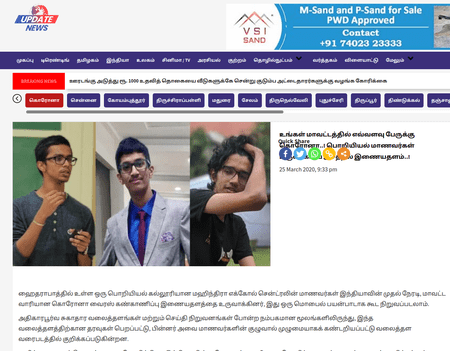
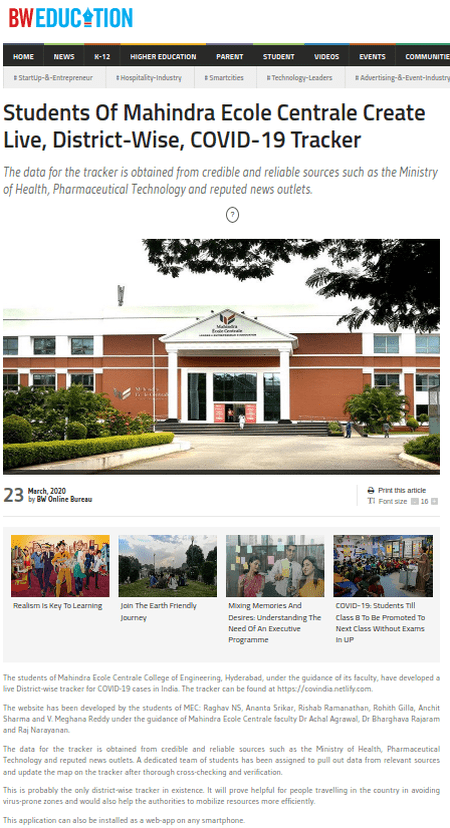
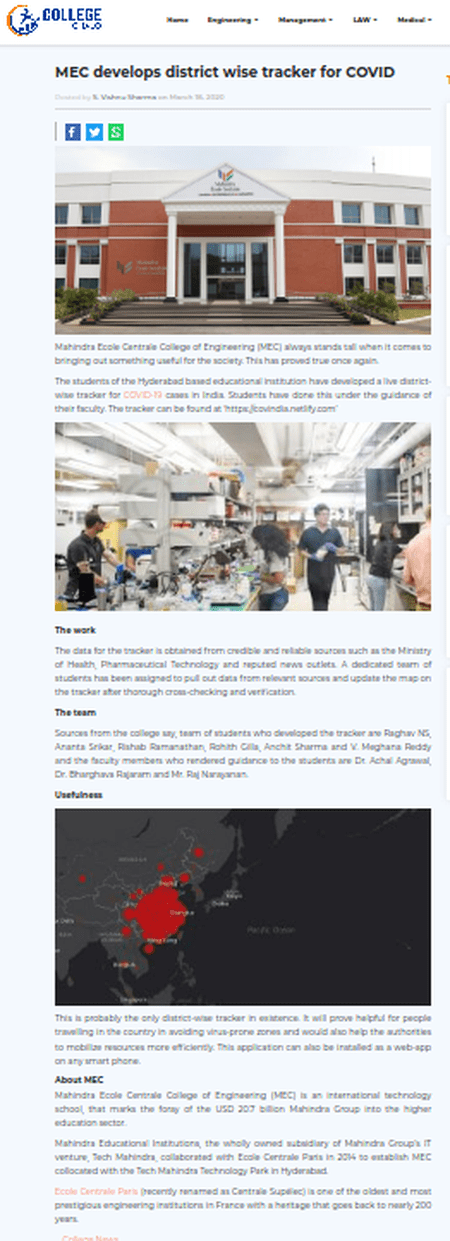
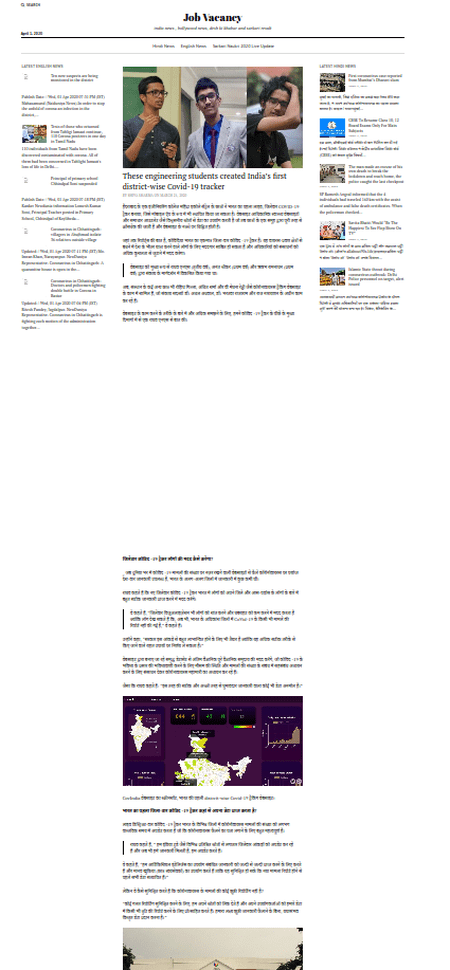
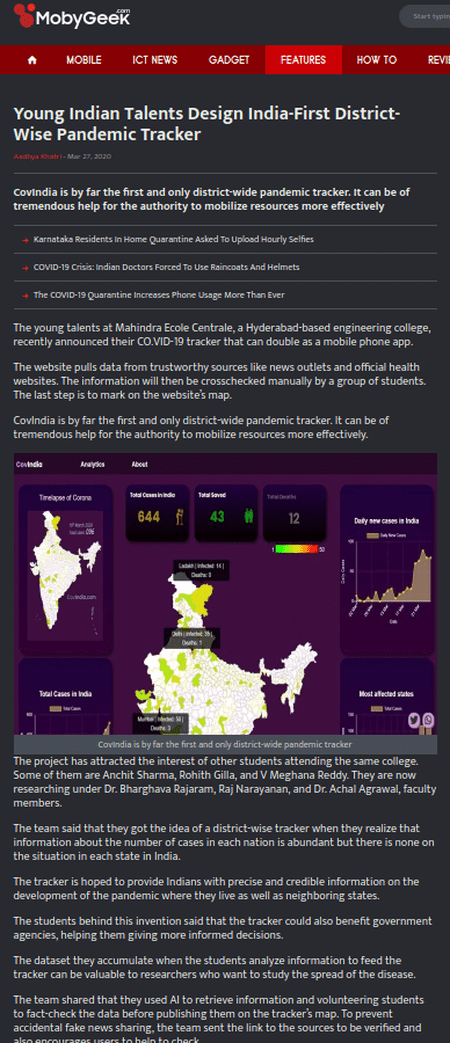
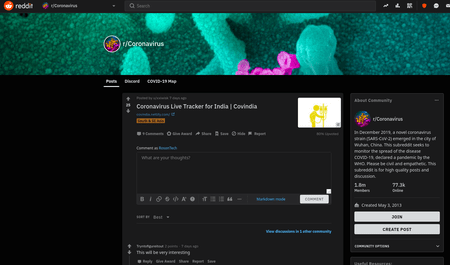
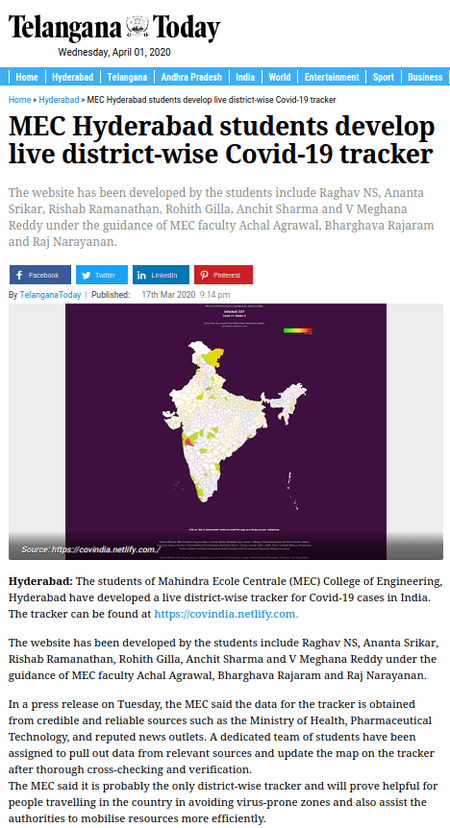
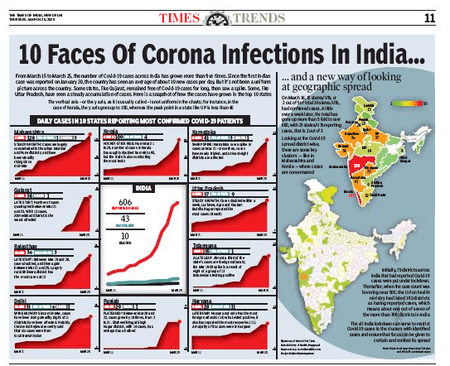
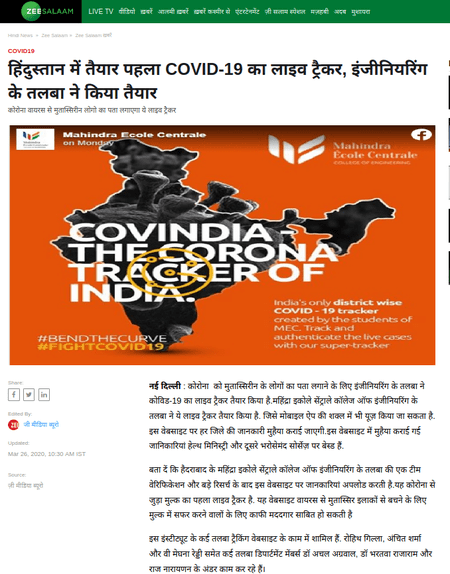
In the meantime, our college released a Press Release and we started seeing our names in newspapers (all linked in the end).
But possibly, the most important thing that happened during this phase was this:
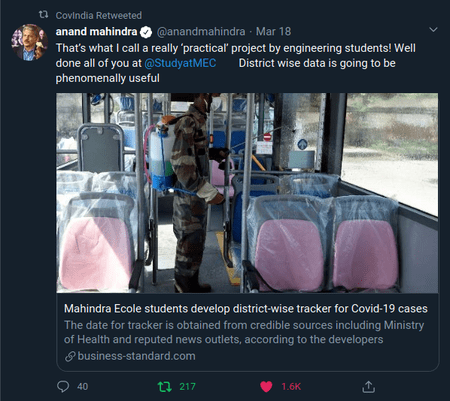
That’s what I call a really ‘practical’ project by engineering students! Well done all of you at @StudyatMEC District wise data is going to be phenomenally useful https://t.co/yz5vVMUtZ0
— anand mahindra (@anandmahindra) March 18, 2020
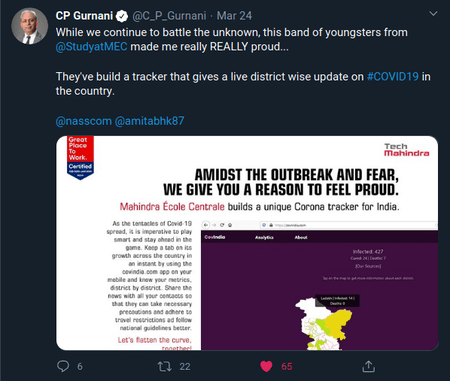
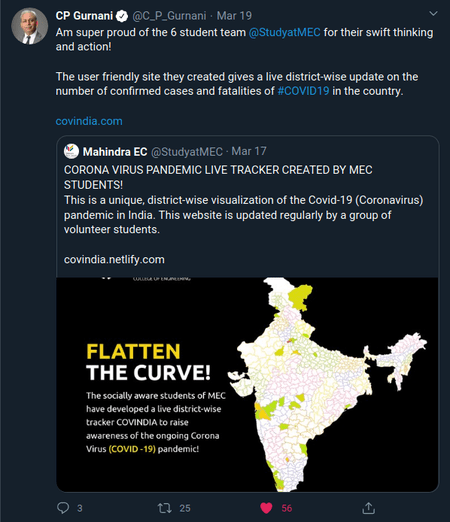
Yes. Mr. Anand Mahindra - an Indian billionaire businessman - a person with 7.5 Million followers - tweeted about us. Along with this tweet, we also had Mr. CP Gurnani, the CEO and MD of Tech Mahindra, tweet about us:
Am super proud of the 6 student team @StudyatMEC for their swift thinking and action!
— CP Gurnani (@C_P_Gurnani) March 19, 2020
The user friendly site they created gives a live district-wise update on the number of confirmed cases and fatalities of #COVID19 in the country.https://t.co/PfYMOUc2HE https://t.co/AEyGanmEtA
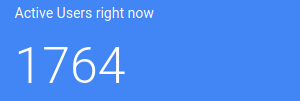
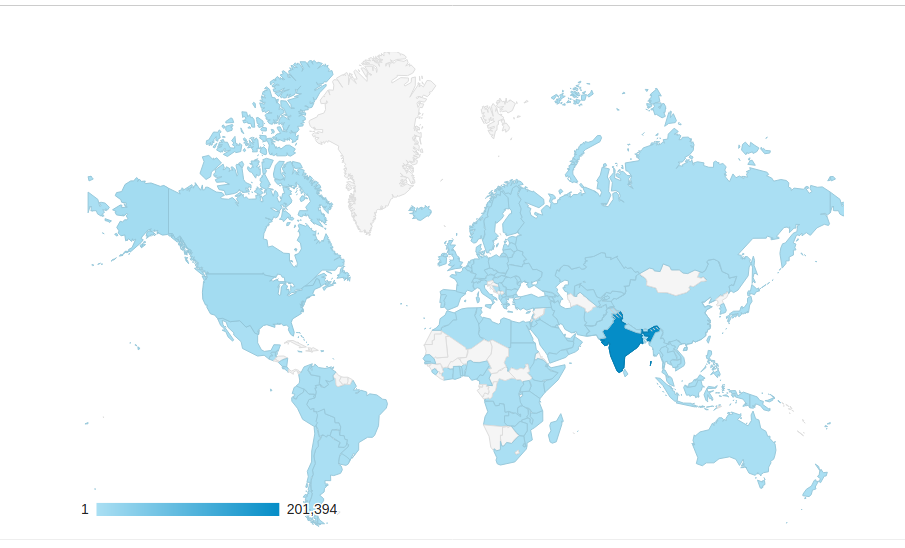
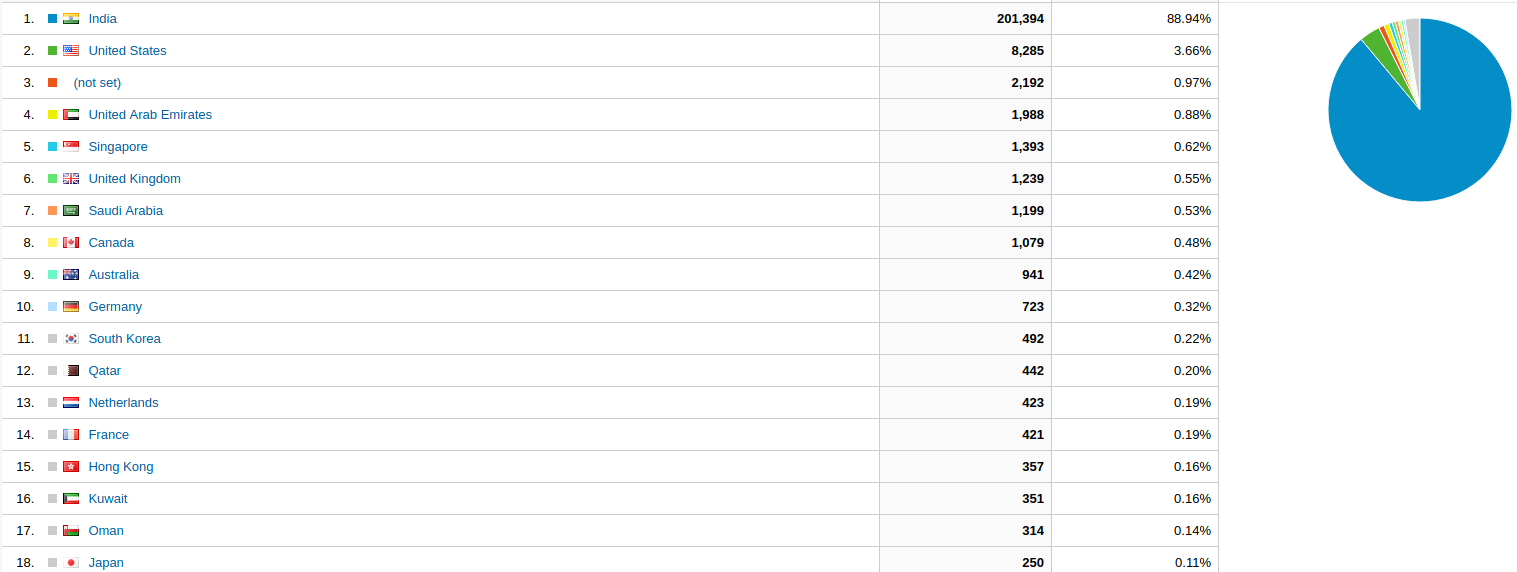
These were two massive boosts to our traffic along with news articles publishing about us and we started getting around 60,000 - 70,000 views a day in the early days of the alpha phase which later became 90,000 views on the last day of the alpha phase. We started getting viewers from other countries as well. The Google Analytics report below shows you the stats:
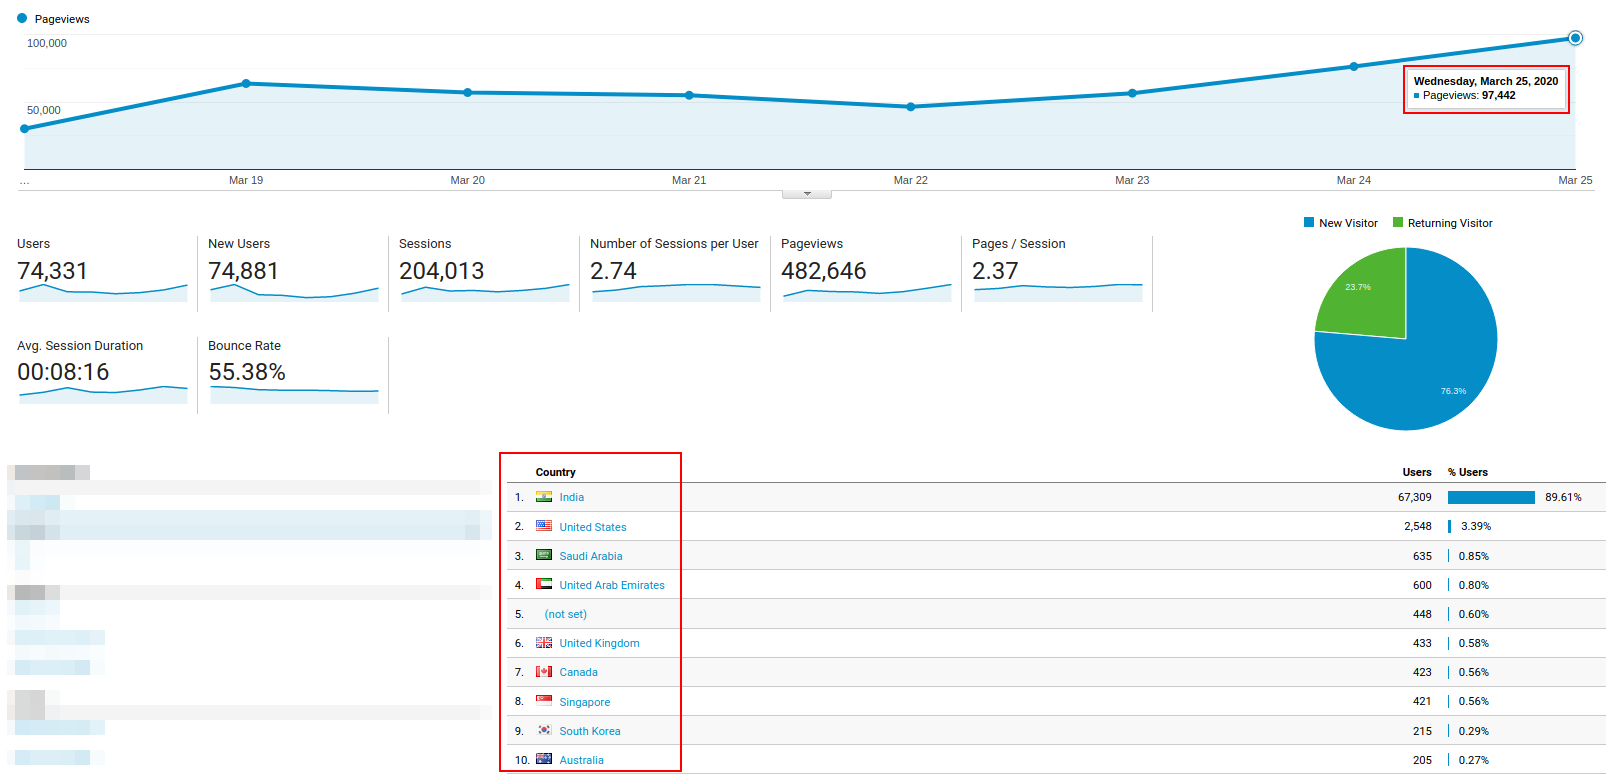
Analytics of Covindia Alpha. Wednesday was when we knew that we were becoming big. Hover on the image for zooming in.
The Alpha phase lasted about a week before we made major changes to the way the website worked. Hence, enter Beta.
How it worked (version beta)
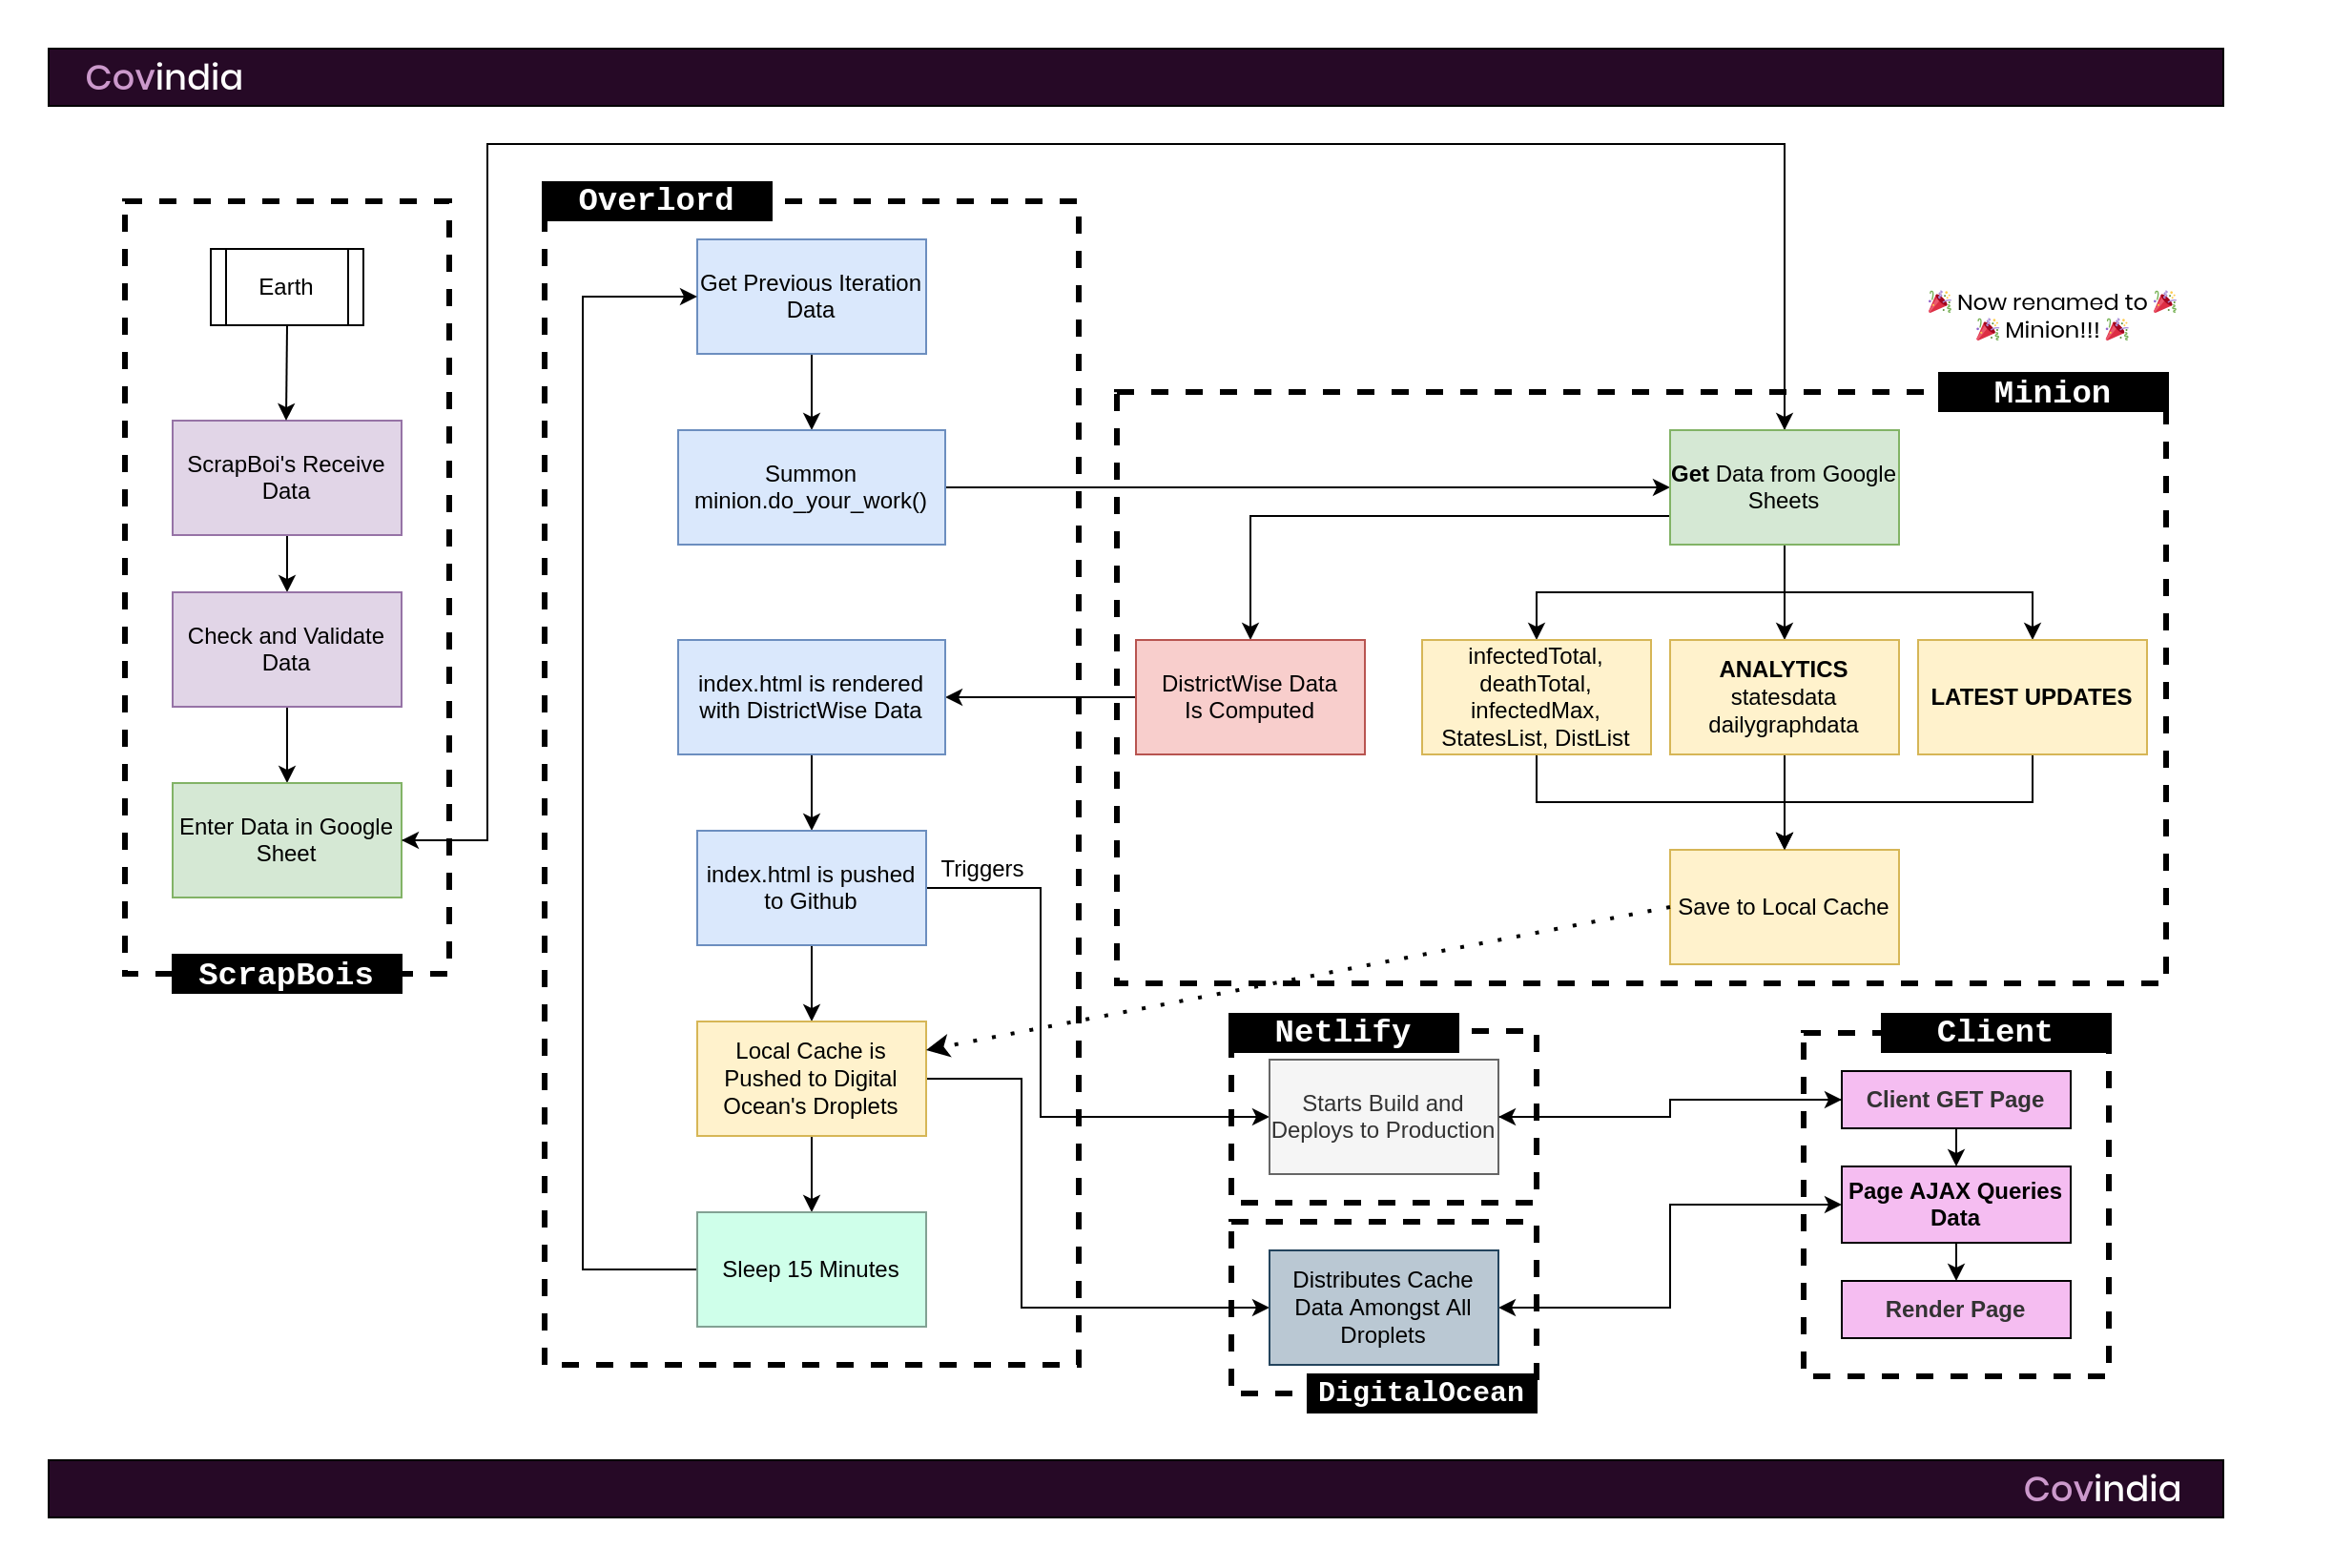
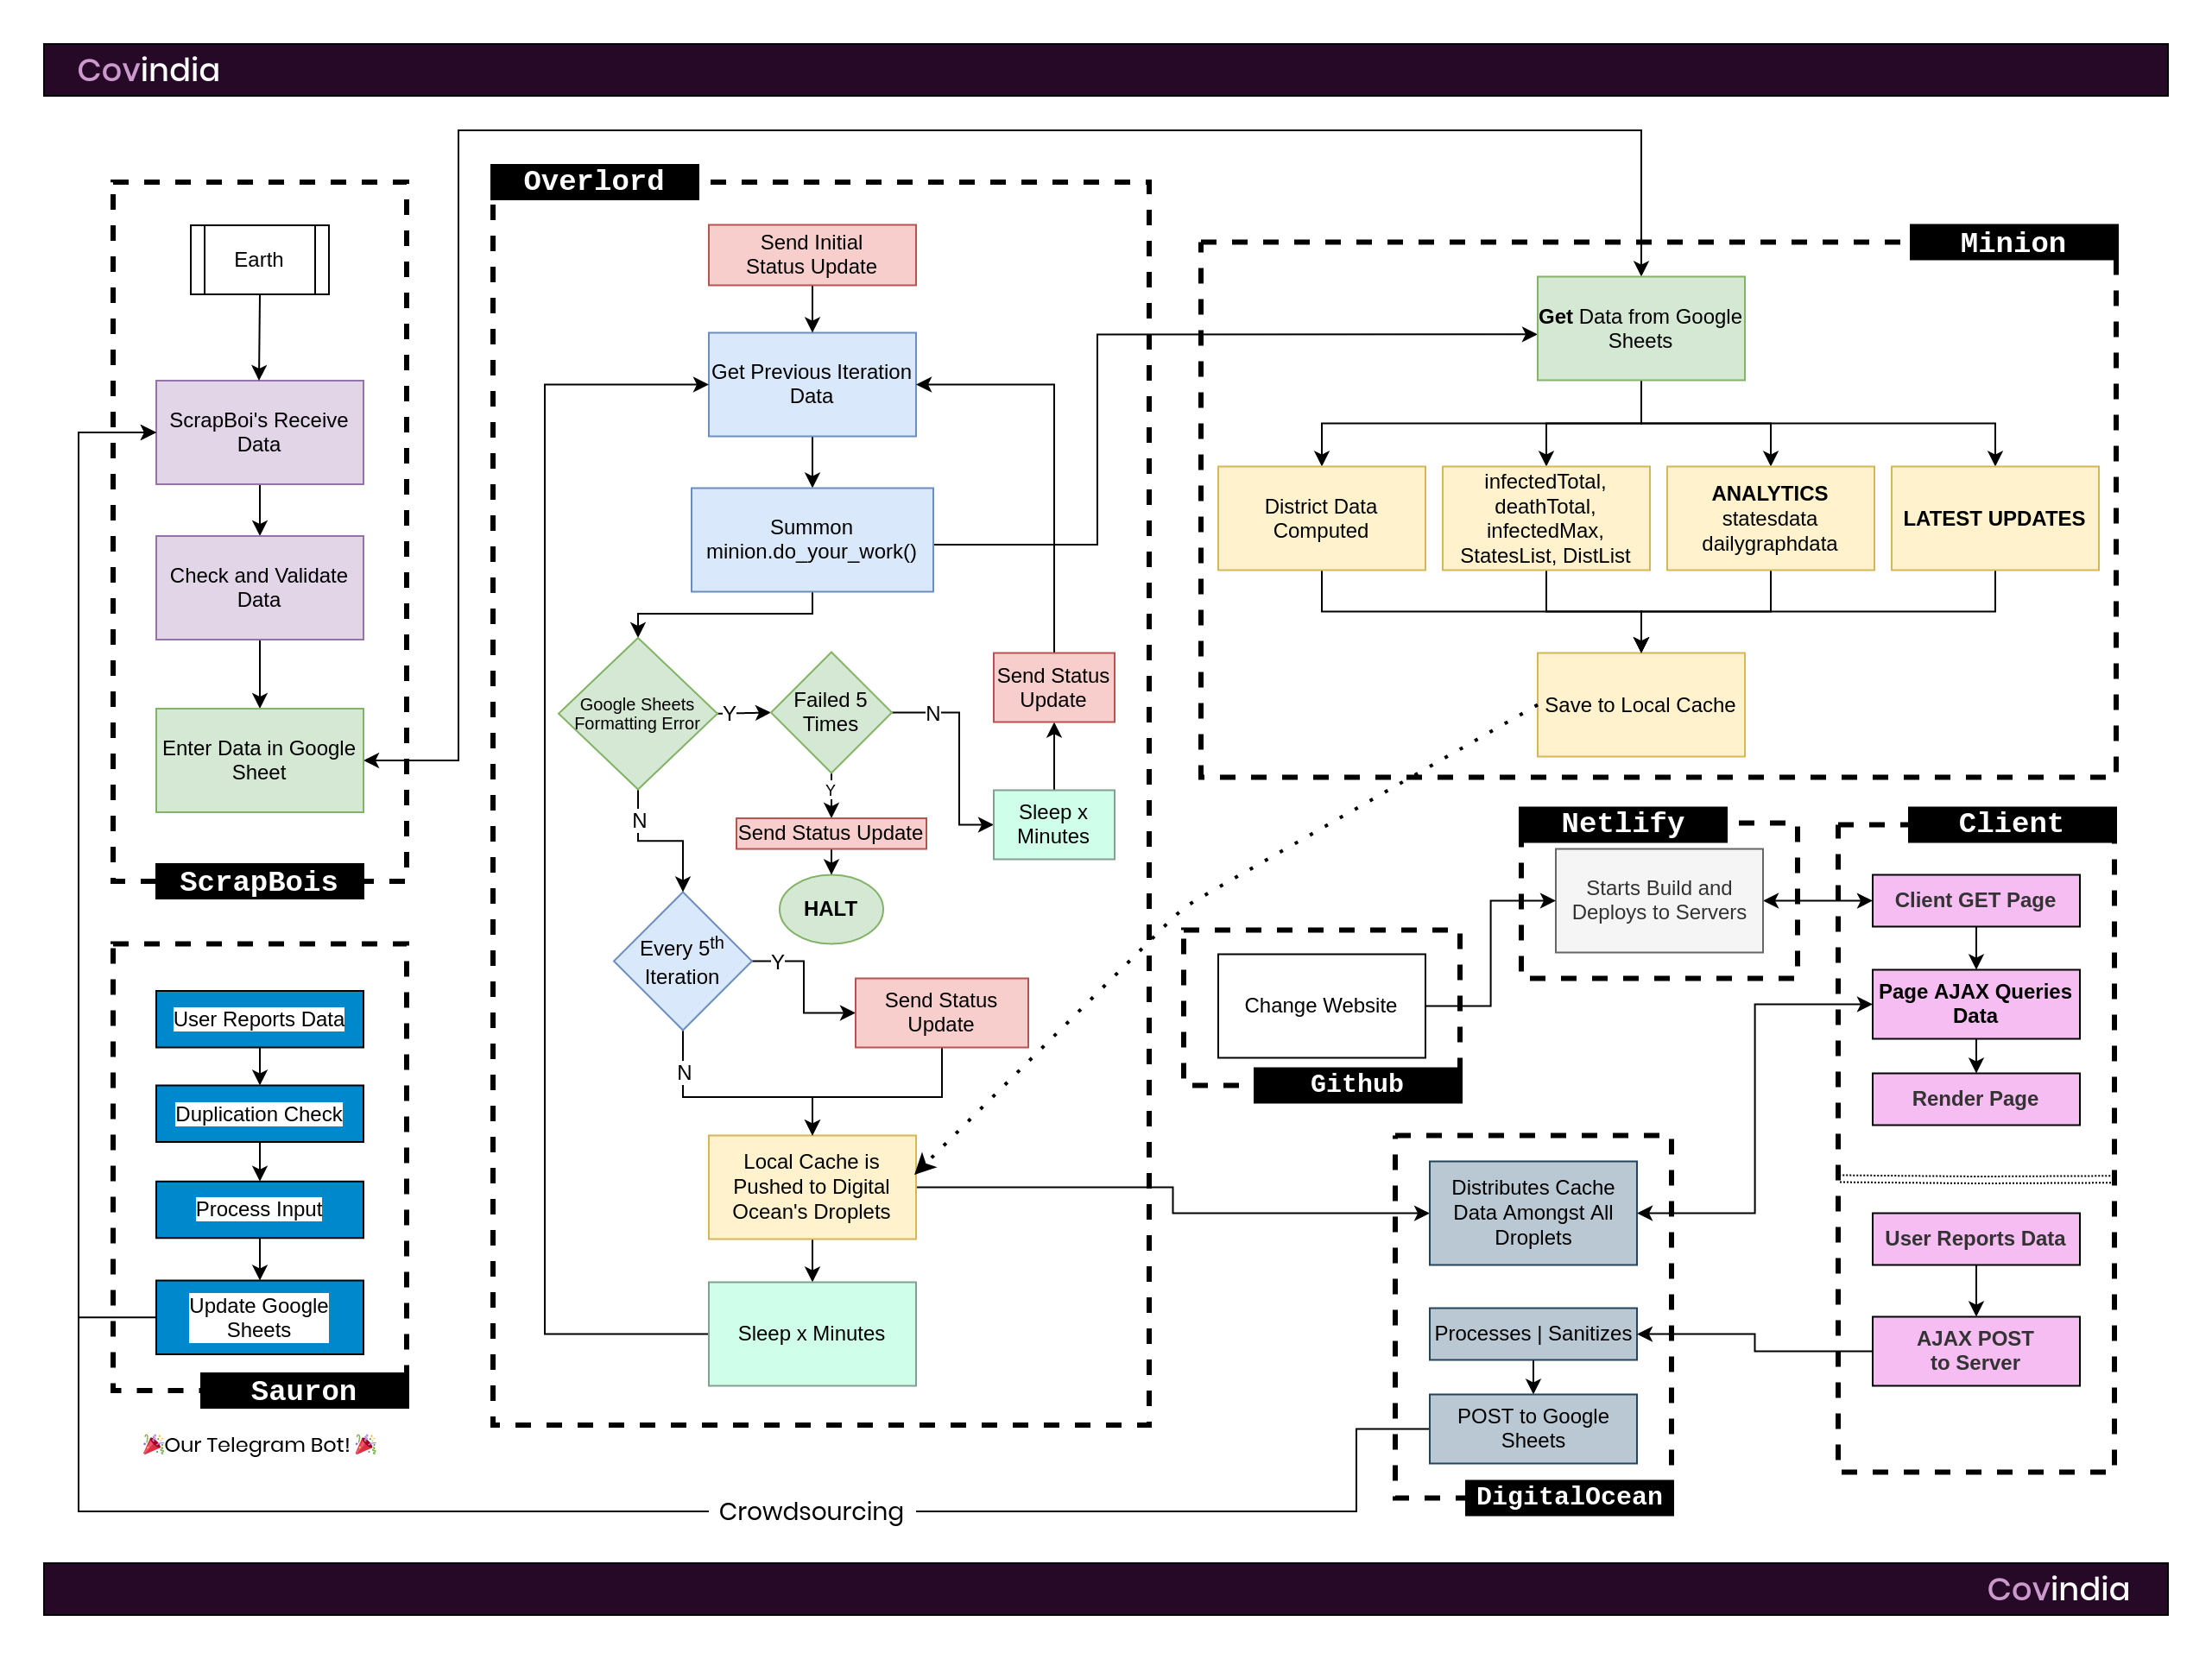
Software Architecture of Covindia version β (Beta). If you think things got messy in the beta phase, oh boy... you're yet to see the latest. Hover on the image for zooming in.
Our beta phase was when we made a massive jump from inserting data manually in base.html and moving it to a proper server. We got 2 Digital Ocean droplets that were meant to be our host the data for our site. The idea was that when a person hits the page, the data no longer exists in the html; it comes from Digital Ocean servers. Enter Sysadmin Friend (they don’t want to be named). They massively helped configure the servers by seting up a DNS Balancer that pointed randomly to one of the two different droplets that was reverse proxied and hosting the app serving data using Caddy. While they did that, I worked on the API which was built with Flask.
Rather than querying the database every time a client wants the data, I thought it was better to keep a local cached file that updated every 15-ish minutes after computinng the required values from the database. Proc was renamed to Minion which would now compute all desired values and save them in multiple files. Overlord, after summoning Minion, would then distribute the new files to the two droplets. However, I still decided that the raw data of districts shouldn’t be put on the server because all it would take is for one person to go through the website and see our API calls that would give them the data that the ScrapBois worked hard to get. This was our biggest drawback and hindrance (this will be explained again in mistakes down below).
We also got 3 new team members during this time: Mayank, Jayesh and Yukta. Mayank was to help out as a ScrapBoi and a Data Analyser. Jayesh was going to help us get the website in a semi-autopilot mode. Yukta was going to help us out with the design.
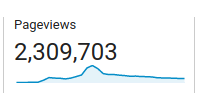
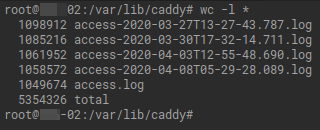
On March 28th, in the middle of our beta, we hit a humongous milestone. 2 weeks after we launched Covindia.com, we reached 1 Million Views. If only we weren’t in the middle of this lockdown, we’d have celebrated it.
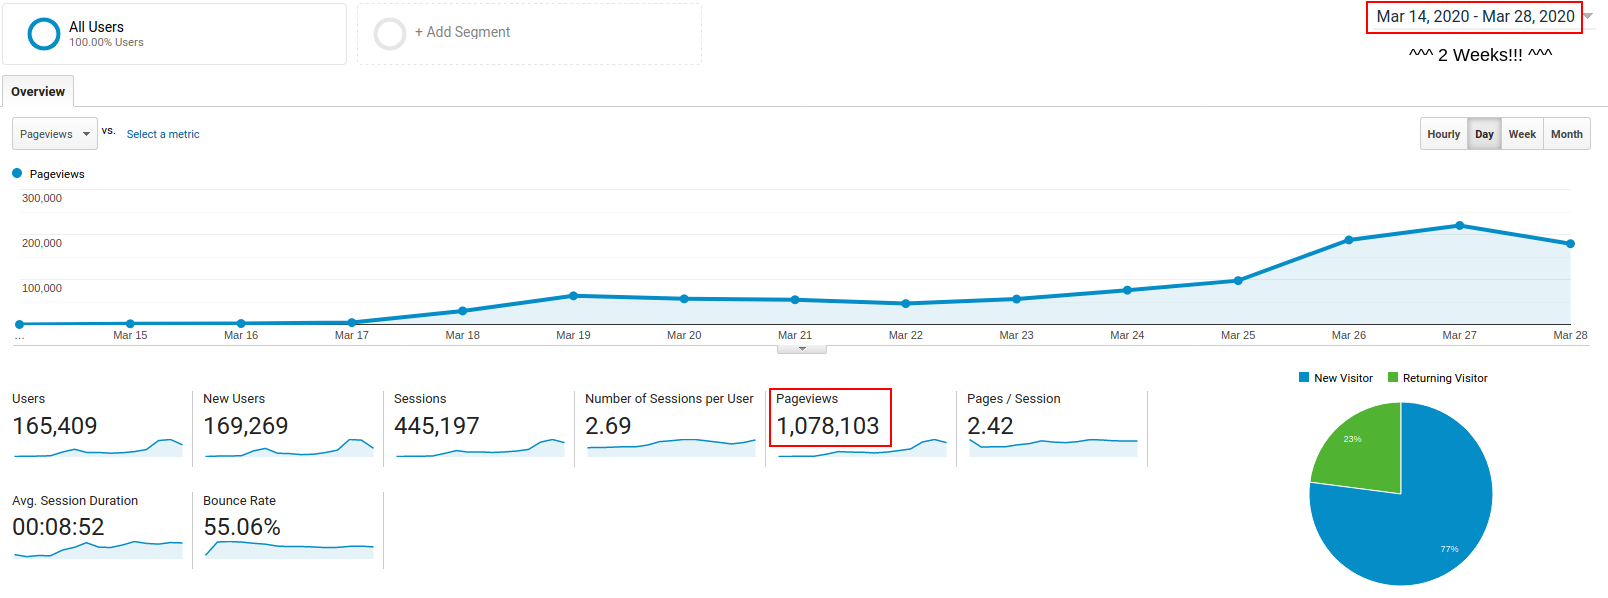
A MILLION VIEWS YEAHHHHHover on the image for zooming in.
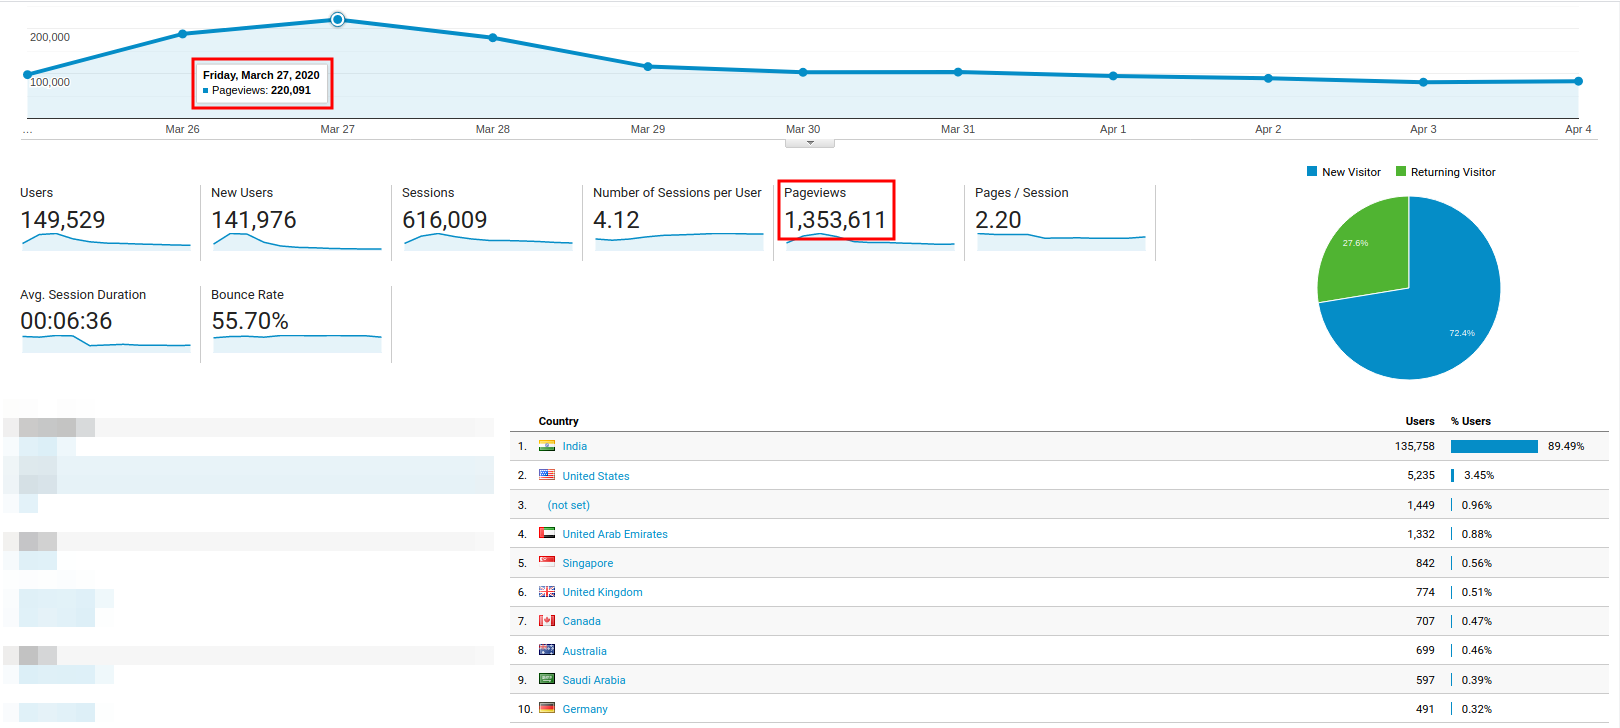
Analytics of Covindia BetaHover on the image for zooming in.
How it works (current & most stable version)