This summer of 2020 has been quite eventful for me. I not only worked on covindia.com, I also worked on the two points I mentioned at the top of that blog post:
- I got selected to be a Summer Research Intern at Rochester Institute of Technology, Rochester (New York) for this summer for 10 weeks under Professor Matthew Wright, The Director of The Center for Cybersecurity Research. I also got a $2,000 scholarship (OMG!). This is happening online this Summer!!!
- 5 students and I got selected for the final round of The Smart India Hackathon. We were one of six teams to get selected for the problem statement posed by a state government from all around the country.
SteaksStakes were high and we started working towards The SIH; the final round was to be held on the 4th & 5th of April. However, this got postponed to somewhere in July due to the COVID-19 Pandemic.
This blog post is going to be about the second point, the Smart India Hackathon. I’ll probably write another one in a week or two depending on my laziness about point one, the internship (I should have finished this post 6 days ago. Shows how lazy I am).
Winning The Smart India Hackathon (and Rs. 1,00,000 (~$1350))
Late January, our college let us know about the Smart India Hackathon (SIH), a nation-wide hackathon that had a ton of problem statements by a ton of governments and organisations. The prize money: 1 Lakh Rupees (~$1,350) per problem statement. Initially I decided not to participate because I had a lot of projects & events to manage (a Software Engineering project, a Enterprising Software Architecture project, intensive Computer Network lab work, a Semester project and TEDx (I was the Co-Organizer) [These are all I can think of at the moment but I know I have plenty more]. The turning point occured when the professor who taught us Software Engineering (SE) said that we could convert our SIH project to our SE project.
This is when I started thinking. If I got selected for the SIH, I could a) complete my SE project and b) get a chance to win a ton of money. As time went by, my mind became fixated on participating and I convinced Rochan (linked below) to participate with me. The problem was we needed 6 people to participate in the hackathon. Enter Ananya, Prakruti, Sai Sree and Saudamini - 4 of our friends who were looking for 2 people to join their team. We met up, decided to participate together and over a few days decided a set of problem statements that we could attempt.
I can elaborate a bit more about the statements, the mini-hackathon to get selected, the application process and the fun stuff involving the application process. But that’s all just floof. Long story short, on February 28th we got to know that we got selected for MK105, a problem statement given by the government of Uttarakhand. The problem statement:
The objective is to develop a software solution to predict the future jobs based on location, sectors, package and eligibility. Big data analysis can be useful to collect and analyze data from different job sites and predict the future requirements applying machine learning / deep learning techniques.
Depending on how you think, this problem statement can either be easy sounding or extremely hard sounding. If you thought that this sounded hard, you were right. Fun Fact: We thought about this problem statement for at least 50 - 60 hours in person and over call just trying to think of all solutions and interpretations of the problem statement (No. That is not an exaggeration). For a problem meant to be solved by students, this was quite complex. The hackathon was to be held on April 4th and 5th in Dehradun, Uttarakhand. We started working day and night to build a prototype and start piecing things. However, some major global things happened (starts with a c and ends with a oronavirus) and the hackathon got postponed. We didn’t know till when and we put a hiatus on the project.
That was all until our SE project. Yeah… We still needed to demonstrate our project to our professor regardless of whether the SIH happened or not. We got working over call again and implemented a fully functional pipeline by the first week of June. We collected a ton of data, had a very scalable backend and a website to show our results, albeit quite primitive. However, the point of the SE project wasn’t results. It was whether you thought about your overall software and whether you designed it properly, which we did. On Tuesday, June 9th 2020, we presented our pre-alpha to our professor on a call that lasted nearly an hour showing our demo, our flowchart and explaining our solution.
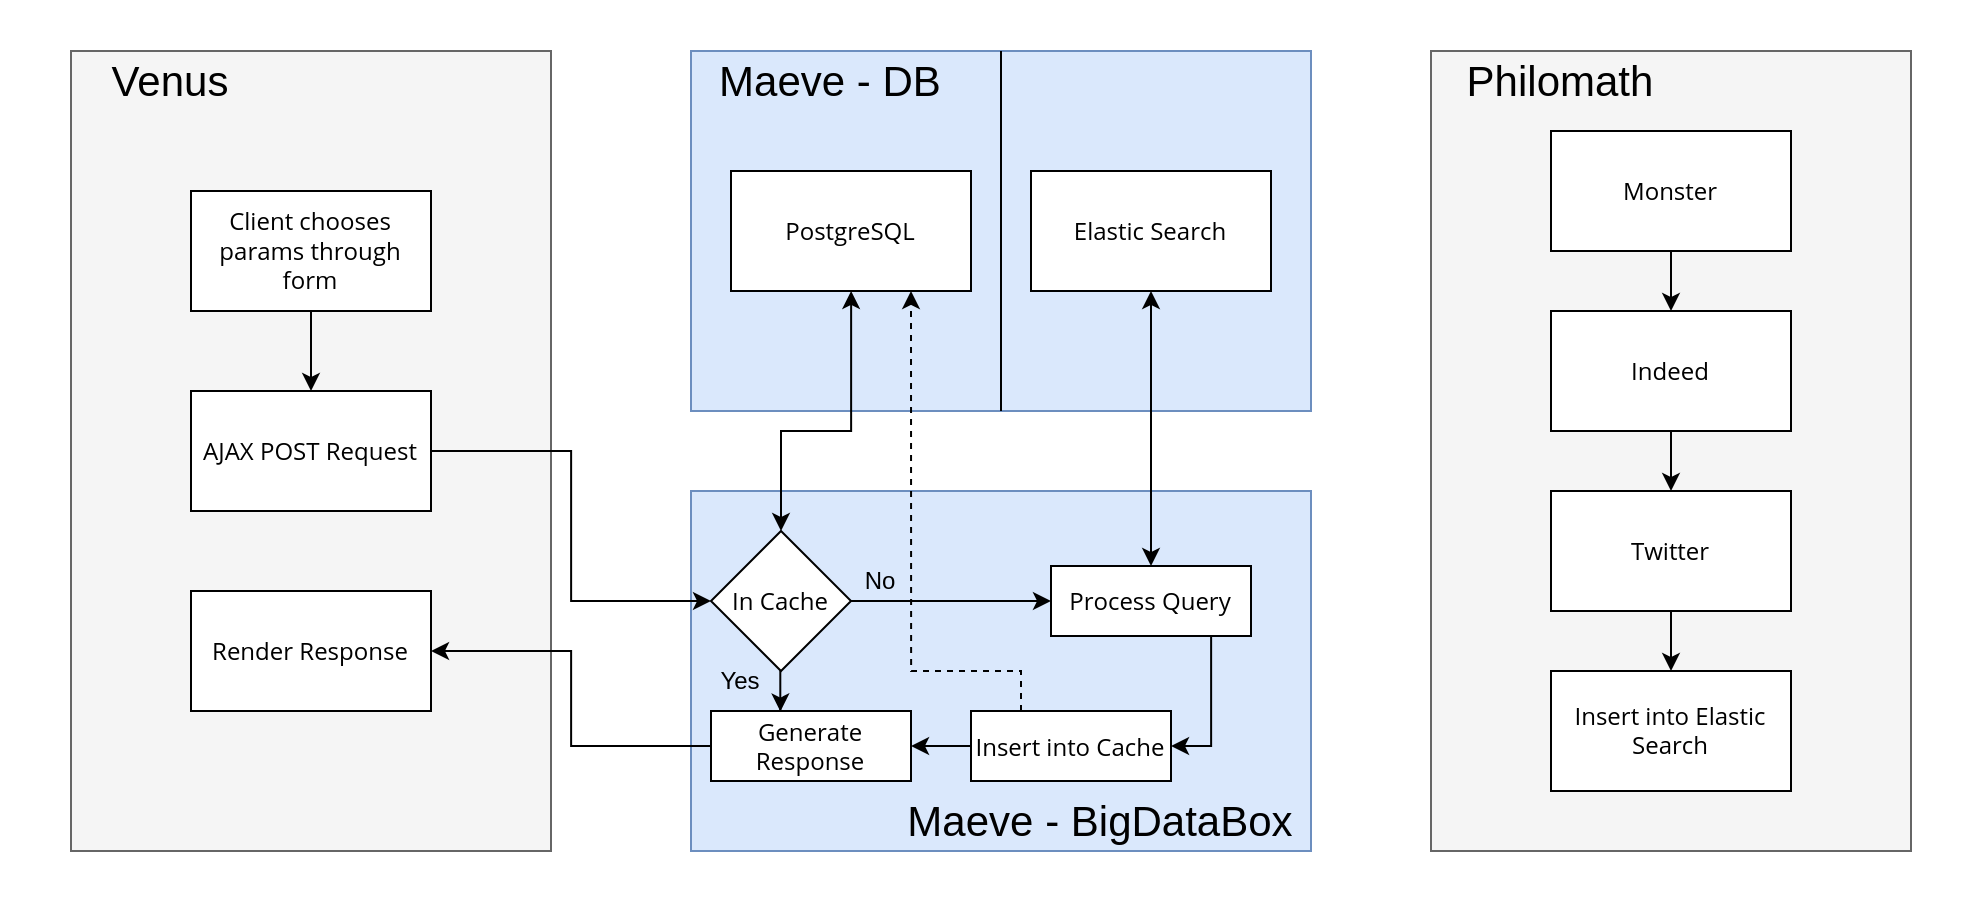
Fig 1. This was our pre-alpha flowchart Hover on the image to zoom in.
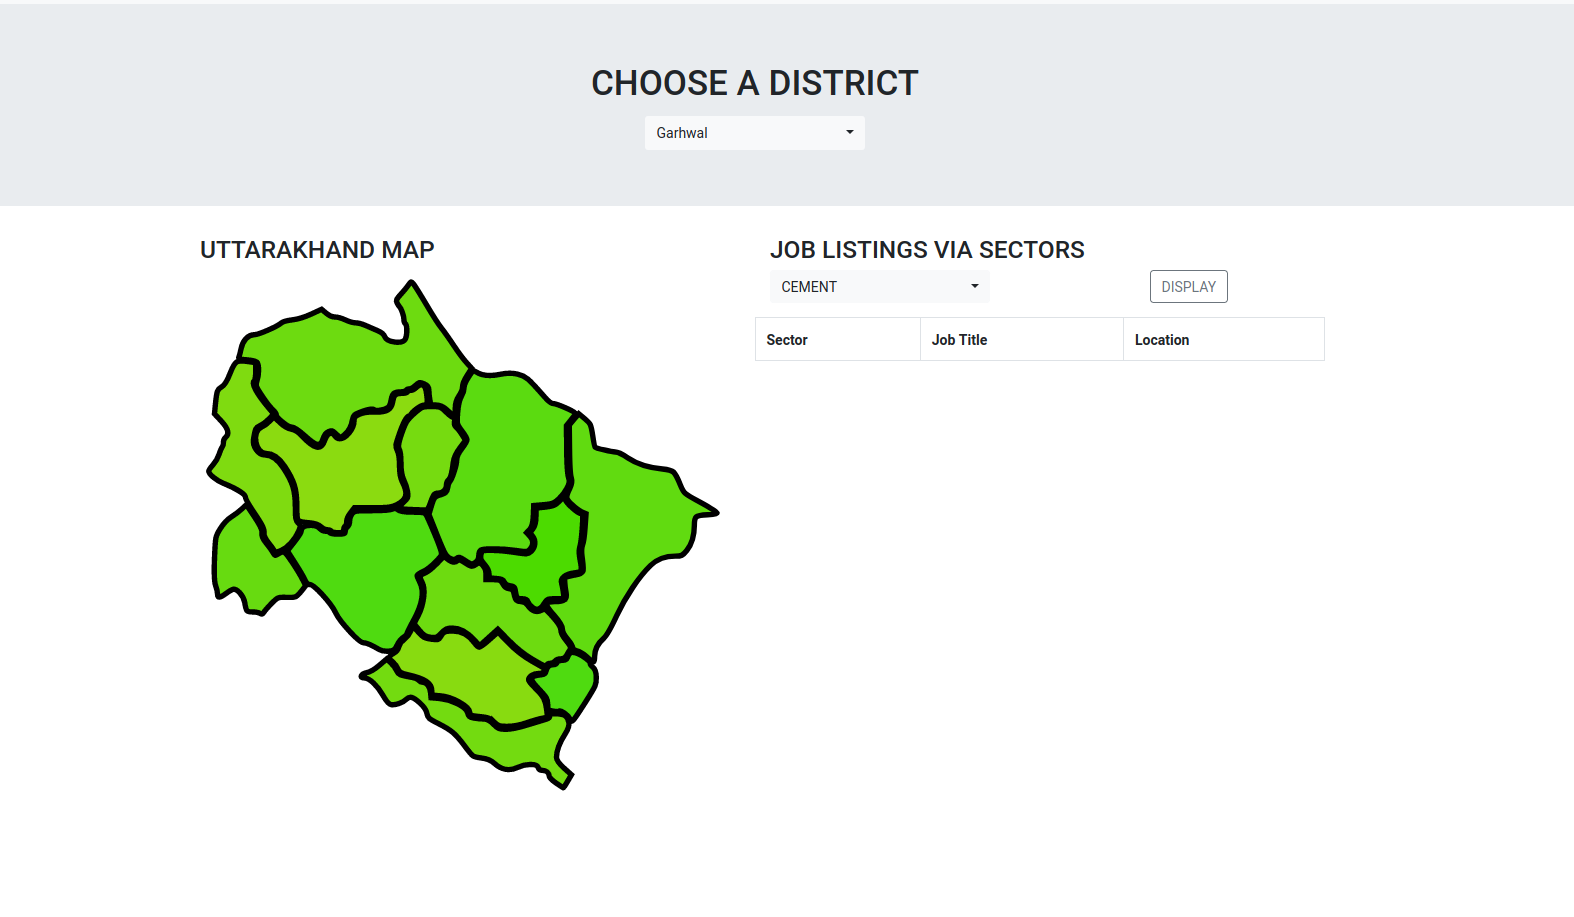
Fig 2. This is how our pre-alpha site looked Hover on the image to zoom in.
On June 17th we finally got an email from The MHRD (The Indian Ministry of Human Resource Development) explaining that our finals were to be online on August 1st to 3rd. They explained a lot more floof, but this is when we started grinding even more than before. We had a ton more calls, thought more about the Problem Statement and the way we wanted to go ahead. The previous sentence does very little justice to how much thought we thunked and how much thunk we actually thought. We thought, thunked and thinked to come up with a semi-solid solution by the end of June. It was at this time, Dr. Bhargava Rajaram and Mr. Raj Narayanan started helping us refine our thoughts to greater levels.
Our thought process (Starting from March)
We figured out the way we could get news of future jobs was to listen to newspapers and see what they said. If the paper reported that “Major IT Company setting up an office in ___ time at ___ location”, we had direct and straightforward information to a future job / sector. The problem was extracting that information from an article. However, we assumed for the sake of simplicity that this information would be in the title of the article (we were trying to show a proof-of-concept instead of building a total product).
We figured that every team would implement a similar strategy. We needed to think of more ideas. One idea we had was that we could ge the latest information about the jobs in the market by looking at job websites. This would give us a picture of how the jobs currently look like. This interlaced with job trends (a black box at that time) would help us realize how a current sector or job was to fare in the near future.
The next question was the black box mentioned earlier. Job Trends. That’s a very vague term. When we sat down to think about it, we realized how vague it truly was. We looked at employement / unemployement, average salaries, number of companies, total contribution to the GDP, import / export contributions, news coverage (positive / negative) and so much more. Obviously, when the problem is quite complex, chances are the solution is probably too. We decided to simplify it for showing a proof-of-concept by considering only a few of these and try to see if we could make some weighted average out of them, fully knowing that it was a thought that required much more thinking and research. With this hypothetical trend-graph of a sector, we could regress and extrapolate information to predict how a sector would do in the future given how it is currently doing.
A lot of it was still very doubtful. How would we average them based on weights? Where would we get the data from? Would the results even make any sense or would they be spurious correlations? Would we get any tangible results? Without thinking too much, we decided to go ahead and started collecting data off of job websites. Ananya took Monster, Saudamini took Twitter (looking for tweets that talk about current topics) and I took Indeed. Within a few days, we had functioning bots that could get us some information from sites. We set them to start collecting data and they collected quite a bit. We analysed this data to figure out what we could extract and we decided on: sector (ex: IT), job title (ex: Software Dev), average pay, location and skills. These would be enough to answer our problem statement.
As time crept on, Rochan set up our backend - a docker container running elastic search, a docker container running PostgreSQL and a Flask API. We were still missing the core “Machine Learning / Big Data Analytics Methods” that the problem statement mentioned, however the backend was designed to make this core ML pluggable anywhere. Our Elastic Search was to contain all our raw data dump. We were collecting highly unstructured data and that couldn’t go into a structured database. Instead we put it in Elastic Search as it scales very well and performs quite well when scaled up. If we ever dealt with tons of data, we wouldn’t have to worry for Elastic Search would save the day. The unstructured data was processed and inserted into a structured database (PostgreSQL) which the API would directly query (and query only. No inserts or any of that funny business to drop table;).
Our front-end devs, Prakruti and Sai Sree, were busy starting with how we were going to visualize our results. Pie Charts? Maps? Graphs? Histograms? Spider Charts? It was very confusing and I admit we weren’t quite sure until the final weeks. For now, it was decided that the site would have a clickable map that would provide one of the inputs: location. Also decided was to have a slider that provided a second input: time. There were dropdown menus for skills/requirements and salary but as time went on, it didn’t make sense to have them. Our reasoning: if we provided those 4 inputs, what would you get as the output? It would become so specific that you’d barely have any output. Instead, location and time would give us a list of jobs + their average pay + the skills required, ergo directly addressing the problem statement.
Around 3 weeks before the final hackathon, we were still unsure of the “Machine Learning / Deep Learning / Big Data Analytics” voodoo magic that was to be made. We needed some NLP to understand the job listing. We needed some way to analyse some past data (that we still had to collect). After analysing that, we needed some way to interpolate the extrapolated results with current trends. It was getting to be a monumental task. And it was precisely here that we had a tiny thought that would turn to be our unique selling point: The Job Web.
Rather than trying to explain The Job Web, it’s better understood with an example:
Imagine that a major IT company is opening up a massive office. When they open up, the employees are going to need to get computers / laptops to work on. Therefore, laptop / computer showrooms nearby experience a tiny boost. The employees will also need a place to stay. Hence, dorms / apartments / real estate in that city experience a proportional growth. Customers of the company who visit the office will want to stay in hotels. The hotel, tourism and hospitality sector close to the office will experience a tiny but significant boom. Employees would want to go to a cafe / a place to eat food during breaks. Restaurants and Dining would experience a tiny upsurge in that area.
This later became our core idea that would help us even more information that we already had. An directed and weighted graph that would tell us how economies, sectors and possibly jobs are interconnected. This was a huge idea and one way we could explain it was by showing Civilisation VI’s Technology Tree (Figure 3). I could find only a bit of information (mainly really long documents) to similar work and only one diagram (Figure 4) that came close to what we had in mind. We wanted to go extensive. We wanted to be detailed. But, in the name of the hackathon, we were going to implement …. (build-up) … a proof-of-concept.
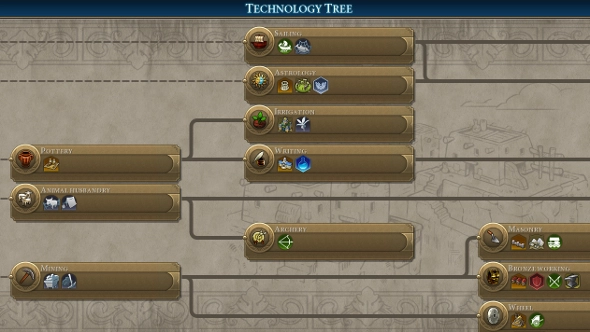
Fig 3. Civilisation VI's Technology Tree. Image [Source].Hover on the image to zoom in.
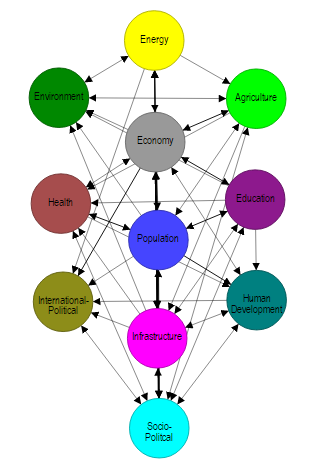
Fig 4. Interconnected Economies. A graph I had found here.Hover on the image to zoom in.
As time moved on, Rochan devised a clever way to use Bayesian Association rule mining along with an Apriori algorithm to extract this information from historical data. Using conditional probability (Bayes theorem), it was possible to determine loosely what jobs influenced other jobs. This was the key “Machine Learning / Deep Learning / Big Data Analytics” solution we had been waiting for. He decided that we would not be implementing a Deep Learning program because it didn’t make sense to be applied here, even though the problem statement mentioned it. KISS - Keep It Simple, Stupid - is a methodology we followed throughout the hackathon => we didn’t want to complicate an already complicated solution.
Now that we had a way to get the results for The Job Web, we needed to represent it somehow. Sai Sree was left with the daunting and humongous task of figuring out how we needed to visualize the data. She considered [this] and tried working on it but couldn’t get something to work for some reason. With only a day or two before the hackathon, she pivoted to zdog, a similar tool which proved to not have the issue. To understand how big of a task this was, it took ~3000 lines of code of JavaScript and nearly 3-4 days to represent what we currently show on our website (linked at the end).
As The Job Web was underway, Ananya and Saudamini started collecting heaps of historical data from websites like CEIC, Central Statistics Office, Statista and more. Truly a very gruelling task, they got a ton of data that could be directly fed to the backend algorithm to form associations. On top of that, they formed a ton of graphs by feeding the data to Flourish, a data visualisation tool that helped make graphs and embed it on other sites. The goal was to show these graphs so that the general user could understand how sectors have been doing over the past decade. These graphs included how various sectors were performing with resepect to other sectors in India and Uttarakhand (our problem statement issuer). They worked for 3 solid days along with Dr. Bharghava to conglomerate, analyse and publish the many graphs seen on our website.
Prakruti meanwhile worked on the elements of the website with Mr. Raj Narayanan, a professor of Design Thinking at our University. Multiple things are considered that you, as the user, normally don’t think about when it comes to the design of a product. Straight from the font used, to the harmony of colors chosen, to the placement of items, to the words crafted, to the images shown, to the delays set, to the elements animated, to the direction of the animations, it was eye-opening to think, design and code all the little nuances that you see on the website. Made with simple HTML, CSS, JavaScript, Bootstrap and Animate.css, the website you see that Prakruti made was very well thought out and intricately styled to make sure that you, as the user, had a smooth experience. We wanted the site to be blazing fast (and hence not going with a not-so-heavy Web Framework).
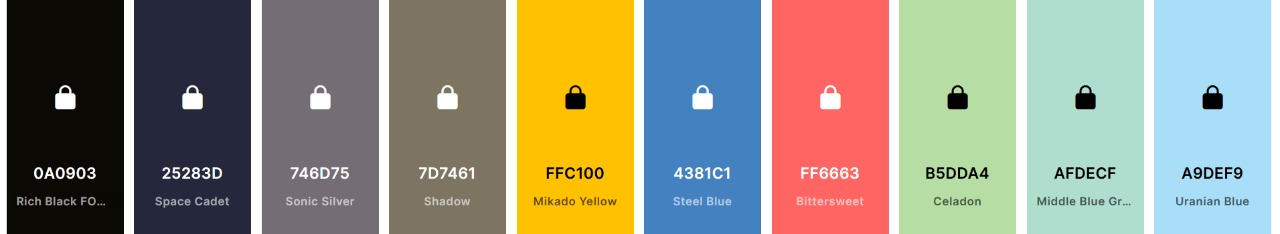
Fig 5. The color scheme we were going to use
Once the day of the hackathon had arrived, we were told that we would have 2 judging / feedback sessions a day for three days. Although things were a little unclear about what was going to happen when, who was going to judge us and what they wanted to hear, we put in a good 1.5 hours before every session to practice what we’d say and a good 1 hour afterwards to review the feedback. This was all done over online calls, making the process harder than usual.
On Day-1 Morning Session, we weren’t judged but instead given feedback from an Executive working in an Oil and Natural Gas company. We were told that our website wasn’t intuitive enough and things looked a bit all over the place. When we convened afterwards, we agreed with the second part but weren’t ready to agree with the first part. On further inspection, we began to realize that our website looked intuitive, but only to us. Of course it did, we designed it with respect to the problem statement that only we knew. We then decided to pump up our efforts to the website and making, instead of a website, an experience that guided you to what you wanted to see.
It was here that Mr. Raj mentioned an idea he had thought of before: customizing the analytics page to the type of user you are. If you were a government official, you would probably want to see how sectors contributed to the entire economy in the public and private domain. If you were a job seeker, you would probably want to see how sectors grew in recent years and how the changes in hiring have been. If you were a student entering college, you could be offered to see what sectors are likely to boom in the next few years, thus helping you choose a major that would blossom once you graduated. The idea was to integrate the profession of a person into the way that the graphs on the analytics page was ordered.
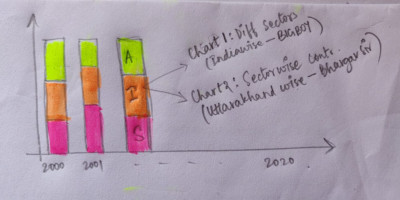
Fig 6. An example graph that could go on the analytics page (Ft. Saudamini's handwriting)
Plans for that were being made and a lot of work was being put in. 6 hours later, we had our Day-1 Evening-1 call with a different mentor who told us that we were being given feedback. The feedback this time was targeted towards the “Machine Learning” crux of the backend, which Rochan was working on version 2. It was all about how we need to justify what we’ve done is better than the other options available. Once the feedback was done, we realized that we were spending too much time explaining the story part of our solution and less about the solution itself. We had only 10 minutes to explain numerous ideas and our story was eating away too much time.
While we were discussing the feedback, we got to know that we would have another call in an hour and this time we were being evaluated. This set us off into a bit of a panic mode but we calmed ourselves down and figured out what we were going to say. We haphazardly rehearsed twice and braced ourselves for our first judging session. One hour and ten minutes later, we had our Day-1 Evening-2 call with a judge who we didn’t know much about going in. We presented extremely well and got all our points across in less than 8 minutes. We explained about our initial solution that got news from the future, how that overlaid with The Job Web, how The Job Web was made, how our analytics page was customized and how the user experience had plans of becoming intuitive. The judge was extraordinarily impressed and even said the word “perfect”. He was excited about The Job Web and was eager to see the results of it. More than anything, he recognized the amount of effort that we actually put in to understanding the quite vague problem statement and coming up with a proper way to address it, an appreciation that made us exceedingly happy.
Fig 7. A pixelated screenshot of one of the judging sessions
After the call, we had our usual feedback review and fixated on what needed to be ready by the next morning. Everyone took a break and had targets ready for our next day 9 AM call. We all worked till a bit late in the night and eventually we started getting things pieced together. Sai Sree was super close to getting the results for The Job Web completed, Rochan was whipping up and testing other algorithms, Ananya and Saudamini were analysing and pruning the results that Rochan’s initial algorithm had delivered and Prakruti was working on completing the site.
The next morning, we had a landing page ready that said “Welcome to Team Rasp’s: Project Joopiter” in a very welcoming way. It led you to the next screen that asked what you did and took you to the analytics page. The UI was falling into place. Sai Sree managed to show us the results of The Job Web and we were thrilled. Except about one thing: it was too connected. Connected beyond a point which you couldn’t make out anything. When we thought about it, it made sense. Since we didn’t have enough data, a lot of associations to the algorithm looked like they just worked. It was here that Ananya and Saudamini decided to help Sai Sree reduce the number of edges. Rochan in the meantime decided to refine the algorithm to overlap newly acquired sector data with job data.
Day-2 Morning Call (non-evaluated) was to happen an hour before noon and we started getting prepared to show the judge (we didn’t know who) our progress. Once we enter the call, we see that it’s a totally new person (again) and we had to improvise to not just explain our initial idea but to show the progress we made in the night too. We managed to present okay-ishly and no general feedback was given. It dampened the mood a bit, but that didn’t stop us from encouraging each other and pushing forward. The whole day, The Job Web was being worked on, the UI/UX was being finished, graphs were being published and algorithms were being set to churn. By the evening, we had The Job Web ready and it looked much better than the morning. Ananya, Sai Sree and Saudamini had really done wonders. Prakruti had done an amazing job to make the site look complete. Rochan had refined the algorithm so well that our backend could show you the results that made some sense (this is impressive for a proof-of-concept). He also got the OCR as well as the summarizer programs integrated. Ananya also was able to whip up a quick bot that got us the headlines of articles from the RSS feeds of numerous news websites which would be fed to our program that looked for certain keywords from a bag of words. We were to have a judging (evaluated) session at around 6 PM and we started rehearsing an hour before.
Day-2 Evening Call (evaluated) happened and much to our delight, it was the same judge as Day-1 Evening-2 who was impressed with us. This time, we got to show them our functioning The Job Web which made them light up with glee. On top of that, our UI/UX looked slick which they said was looking good. They also asked to see the line of code where we actually call the Apriori algorithm to prove that we just didn’t use fancy words and Rochan was able to show the line in the program running on the server itself. They were happy that we had everything working and this time they said the word “perfect” twice. After the judging, we were feeling thrilled in our feedback review meeting knowing that we probably just scored a lot of points.
We were pretty much close to completion with the website as whole and the rest of the night involved integrating the job web on the site, getting the analytics page working, getting the icons and content for the How It Works and Ideas page. By the next morning, we had a fully functioning and connected site that just needed a bit of refining. Our custom analytics page was now customizable thanks to Ananya and Saudamini, our How it Works and Ideas page were being updated by Prakruti with content and the Algorithms + API managed by Rochan was complete and working without a glitch.
On the Day-3 Morning Call (non-evaluated), we again got a new judge who was to give us feedback on our progress. This was getting a bit frustrating because everytime we had a new judge, we had to explain our entire idea and had little time to explain the progress we made. Somehow we got essential feedback that didn’t require too much tuning of the site and we were able to work on the minor comments. The rest of the day involved fine tuning everything to make it perfect. We completely completed the website till completion and we had one hour left. During the day, Ananya, Rochan and Saudamini started writing the READMEs for our repository and the sub directories as well as merging branches to master. We wanted to work in a Github organization with three different repostories (Website, Algorithms + API, Data Acquisiton), however we were told that we were to create only one and hence the need to create a gazillion branches. Prakruti was touching up all the pages (and made the How it Works page look really glam) while Sai Sree created the footer and tested everything on the site.
An hour before the final judging, we rehearsed with our mentors about what we say and how we say it. We decided the order, what we’d show and what we’d say. It was the final moment of truth. All the insane effort we put in over the past five-ish months was building up to this final call. We didn’t know who the final judge was going to be, so we prepared for every situation. New judge who wants to see UI | New judge who wants to know how it works | Old judge who wants to see progress | Old judge who wants to feel the experience | Default Fallback. At around 4 PM, we were notified that we were due to present in 10-ish minutes and we were mentally got ready.
We entered the Day-3 Evening Call (final evaluation) and to our surprise, we had two judges. One who we knew from the Day-2 Morning call and another new judge entirely. This threw us off the track a bit, but we were able to adapt quickly. We started speaking when the judge we met before interrupted us by saying that they wanted to see only the results. This threw us off the track even more but we were able to effectively show them the three things we wanted them to see: a) a custom analytics page, b) The Job Web - the direct result of our algorithms’ analysis and c) our clickable map and slider that answered the problem statement directly. As soon as we were done, they said all was good and thanked us without giving a chance to explain our future ideas (which we had a ton of) and show them the entire experience of our site.
This left us quite shook because all our effort came to an anticlimactic close. We were, however, happy that our site was live and we mentioned it to them for them to check it out later if they wanted to. We were hoping that this would give them the opportunity to visit the site in case they wanted to view it again. Upon communicating with the other teams, we found out that all the other teams received a similar response from the judges. No demo, just results. This put us at ease because now we learnt that everyone faced the same issue and not just us. Well, there was nothing left to do other than wait for two days for the winners to be announced. 1 Lakh rupees (~$1,350) was on the line and nothing but anxiety about who won was left. We had our final “good job team!” call and were proud of the the solution we developed. This was one of the smoothest hackathons we’d been a part of primarily because we were able to hit every target we had. Near-perfect. We were relieved that this was finally complete and decided to get a good night rest.
We wake up the next morning to see a message saying that the plans had changed and that the results would be announced that evening. Cue spike of anxiety. I had a multitude of thoughts and even got into a philosophical debate with my mom about religion just because I couldn’t channel my anxiety in any other form. After all, we had been dreaming of winning for 5 to 6 months now. We had easily put in over 60 - 80 hours in meetings, modified over 5,000 lines of code and slept for a few hours every night for three days. Anxiety was for sure to be there.
The moment of truth finally came. We waited from 4 PM to 6 PM and finally at around 6:10 PM our nodal center released a pre recorded video on YouTube. We hastily sped through the video looking for where they announce the winners until we heard Prakruti yell, “GUYS OMG! WE WON! OMG OMG!”. The sweet relief. The sweet feeling of the weight lifted off my shoulders. The sweet sensation of winning. Prakruti told us the timestamp in the video and yep, we were mentioned as the winners of the problem statement # MK105. All our hard work, all our effort and all our brainstorming sessions had not gone to waste.
The next few hours went (for me) in a blur. I had family calling, friends texting and sleepiness settling in. I finally slept early that night. That’s actually not true, it just felt poetic to say that. I had an internship meeting in an hour after the results were announced so I had to prep for that. This has been the smoothest hackathon I have been a part of so far and I’m glad to have won it with this team.
Here are the links:
- https://icecereal.github.io/rasp-redirect -> our site. Be sure to check out all the pages!
- Github repository (contains a flowchart)
- The SIH Website
- The YouTube Video where they announce the results | (10:00 is where we’re announced as the winners)
The Team:
- Ananya Kosuru
- Prakruti Singh
- Rochan Avlur
- Sai Sree Pokala
- Saudamini Thakkala
- Dr. Bhargava Rajaram
- Mr. Raj Narayanan
- Me
:The God of the New World
Post Script: Wow! I wrote a lot. There are probably more things I missed out than the amount of sentences I’ve written here. I wanted to say things like how I loved the icons and catchphrases in our How it Works page, how the yellow theme of the website is unusual yet quite exquisite leaving an impression, how the API randomly has two telangana entries, how the job web is more impressive than you think. However, it’s practically impossible given my lazy nature to type that much. You want more information ask the other dudes mentioned here.
Post Post-Script: a) Bloop and b) I hate his face.